From R to Report: How to use Stargazer
In this tutorial:
-
What is Stargazer, and why should we use it?
-
Summary tables
-
OLS regression result tables
- Including custom standard errors
What is Stargazer?
Stargazer is an R package that creates LATEX code, HTML code, and ASCII text for well-formatted regression tables, with multiple models side-by-side, as well as for summary statistics tables, data frames, vectors, and matrices.
Why should we use it?
Compared to other output packages, Stargazer stands out for three reasons:
- Ease of use
- Support for multiple models in OLS regression tables
- Professional, publication-ready aesthetics
For these reasons, Stargazer is widely used in research papers, presentations, and academic demonstrations.
Installing Stargazer
You can install stargazer into your R packages in the usual way:
R
install.packages("stargazer")
library(stargazer)
Example Dataset: mtcars dataset
For this guide, we will use R’s built-in mtcars dataset. A data frame with 32 observations (cars) and 11 variables, giving specs and performance metrics for different car models from the 1970s.
These results will appear in your console, but to download you must and save your Stargazer tables, you must specify the out argument:
For this guide, we will use R’s built-in mtcars dataset. A data frame with 32 observations (cars) and 11 variables, giving specs and performance metrics for different car models from the 1970s.
1. Descriptive statistics
You can quickly generate a clean summary statistic table for your dataset with the following line of code:
R
stargazer(mtcars, type = "text")
R
stargazer(mtcars, type = "text", title = "Summary Statistics", out = "summary.txt")
stargazer will automatically recognize the type of object, and will produce the appropriate output. In the case of data frames, it will display summary statistics. Therefore, if we want to create a summary statistics table including all variables in a data frame, we can directly put the data frame name in.
The 'out="table1.txt" is to specify the name of the file we created using stargazer. The table will be saved in your current working directory with whatever name you write in the out option. You can open this file with any word processor like Microsoft Word, Google Docs, or LibreOffice Writer. If you are not sure about your current working directory, just type in getwd() in the Console.
We can also use the html format:
Similarly, you can find the html file named 'table1.html' in your current working directory, and you can choose the preferred word processor to make any modifications if you want. The output will look like this:
The 'out="table1.txt" is to specify the name of the file we created using stargazer. The table will be saved in your current working directory with whatever name you write in the out option. You can open this file with any word processor like Microsoft Word, Google Docs, or LibreOffice Writer. If you are not sure about your current working directory, just type in getwd() in the Console.
We can also use the html format:
R
stargazer(mtcars, type = "html", title="Summary Statistics", out="summary.html")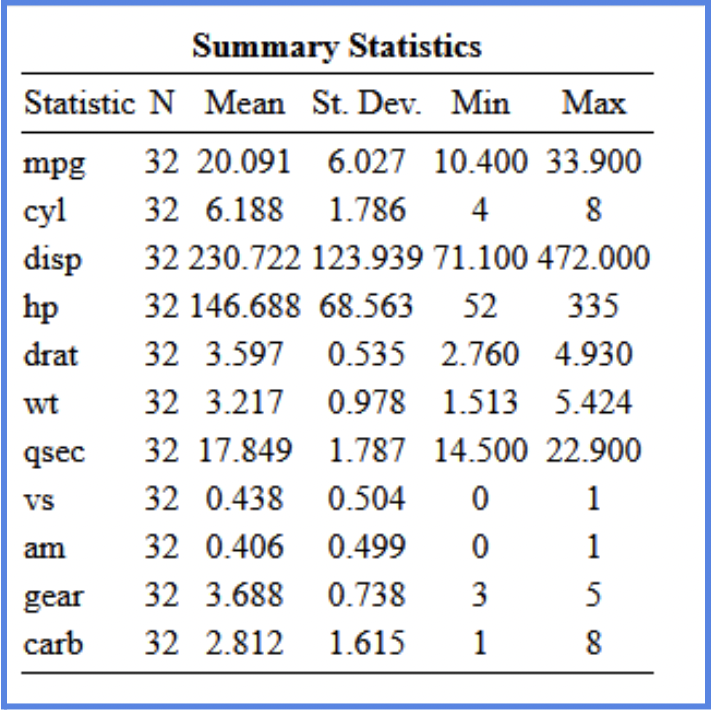
NOTE: The html output will not show in the Console. You will need to find the html document in your directory.
Many have a preference for the HTML version for its clean look and flexibility, but you can choose whichever format best fits your workflow.
We can also use the "flip=TRUE" command if we want the variables in columns.
We can also use the "flip=TRUE" command if we want the variables in columns.
R
stargazer(mtcars, type = "text", title="Descriptive statistics", digits=1, out="table2.txt", flip=TRUE)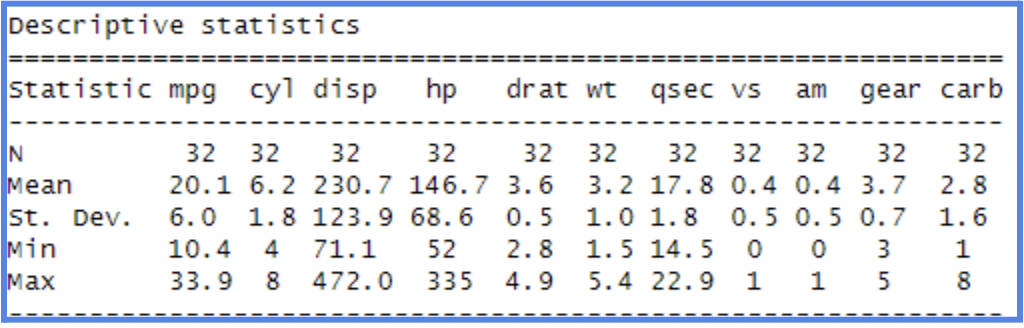
NOTE: If you use the text format, make sure to create a new name for each table, otherwise it will cause errors. This does not apply to html format. You can use the same name for the tables, and they will just overwrite the last one.
Descriptive statistics of selected variables
Often we do not want to report the summary statistics of the whole dataset, but only the variables of interest. We can do that in the stargazer package as well.
Often we do not want to report the summary statistics of the whole dataset, but only the variables of interest. We can do that in the stargazer package as well.
R
stargazer(mydata[c("mpg","hp","drat")], type = "text",
          title="Descriptive statistics/selected variables", digits=1, out="table4.txt")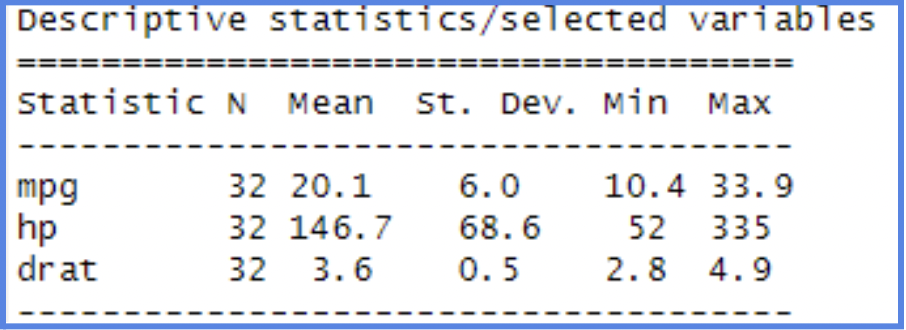
2. Regression Models
You can use Stargazer to generate clean OLS regressions result tables and save them directly in your word or browser viewing.
First fit your regression model:
First fit your regression model:
R
m1 <- lm(mpg ~ hp, data=mydata)
summary (model)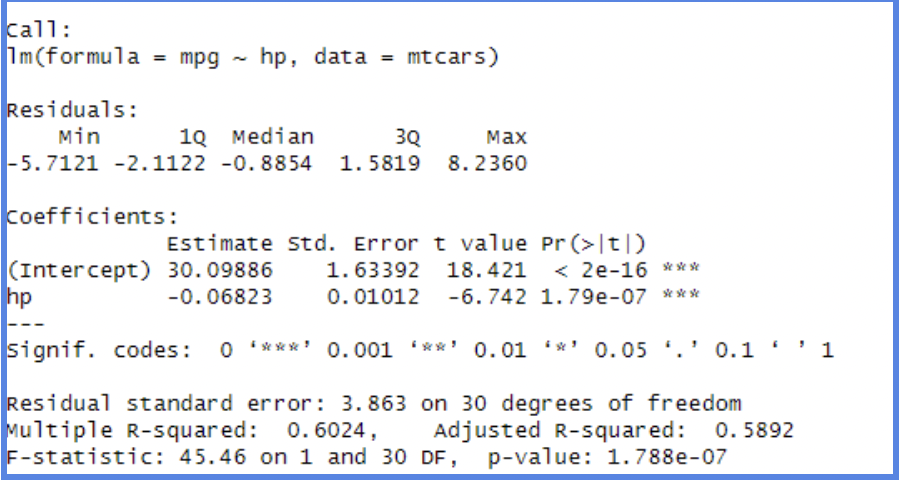
Once the model is fitted, you can save the regression output as a .txt file or .html for your browser.
R
stargazer(m1, type = "text", title = "OLS Regression Results", out = "regression_results.txt")
stargazer(m1, type = "html", title = "OLS Regression Results", out = "regression_results.html")

We can see that the table shows the coefficients and its standard error(in the bracket underneath the coefficients). Also, the level of significance is displayed as well, by the number of *. It also shows the observation number, R-square and Adjusted R-squared.
Linear Regression Multiple Models
When we want to compare multiple regression models and assess their results and significance, we can use the stargazer package to report them clearly.
R
m1 <- lm(mpg ~ hp, data=mtcars)
m2 <- lm(mpg ~ hp + drat, data=mtcars)
m3 <- lm(mpg ~ hp + drat + factor(gear), data=mtcars)
stargazer(m1, m2, m3, type="text", title = "OLS multiple models", out="models1.txt")
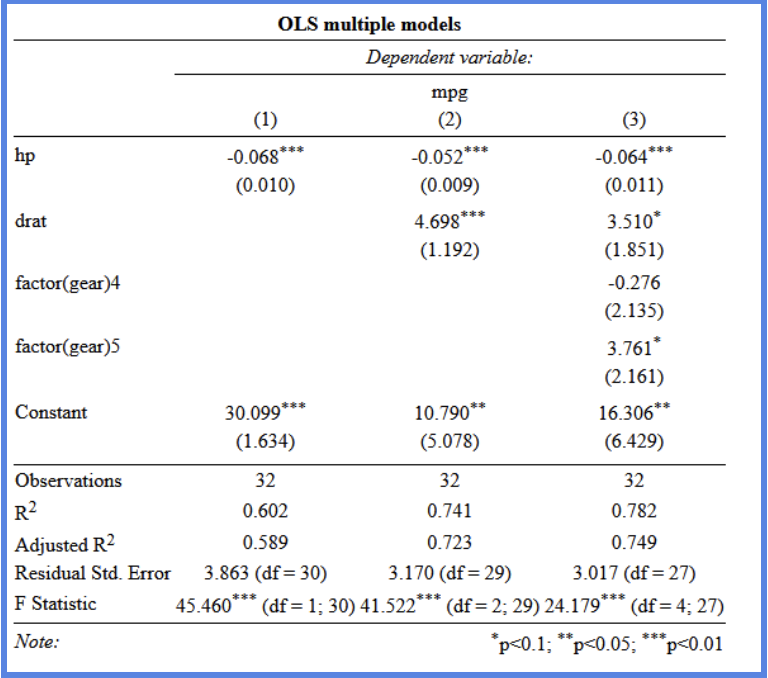
stargazer(m1, m2, m3, type="html", title = "OLS multiple models", out="models1.htmlText:
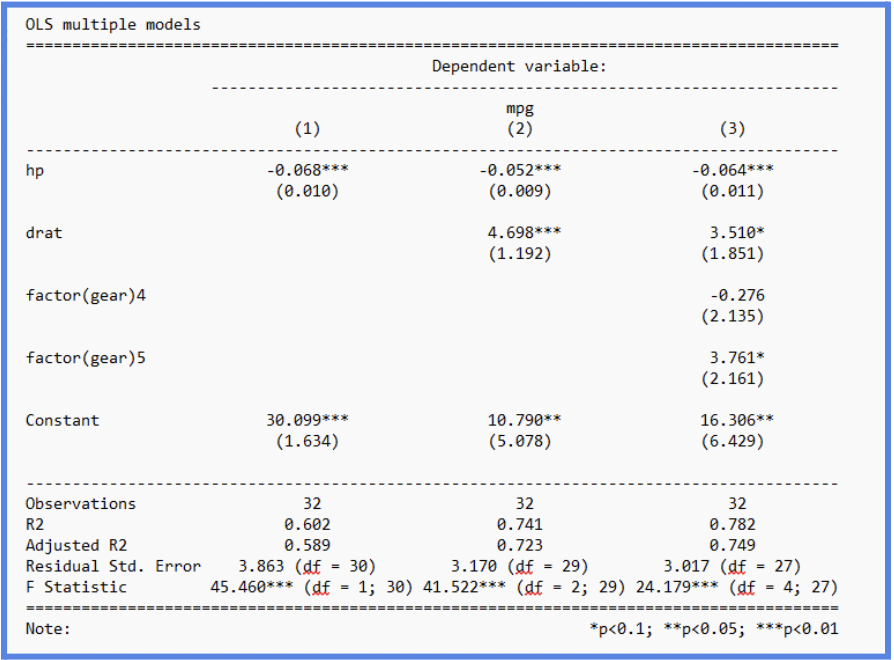
HTML:
As a final note, to improve clarity, you can use the covariate labels option in stargazer to replace variable names with more descriptive labels in the output. For example, even though we may know what a variable like mpg means, readers unfamiliar with the dataset might find it confusing. It’s important to provide the labels in the same order as the variables appear in the dataset. If you are unsure of the correct order, first create a table without labels, review the variable sequence, and then apply the appropriate labels. This approach helps make your regression tables clearer and easier for readers to understand.
R
stargazer(m1, m2, m3, type="text",
          covariate.labels=c("Gross horsepower","Rear axle ratio","Four foward gears",
                             "Five forward gears","Type of transmission (manual=1)"), out="models2.txt"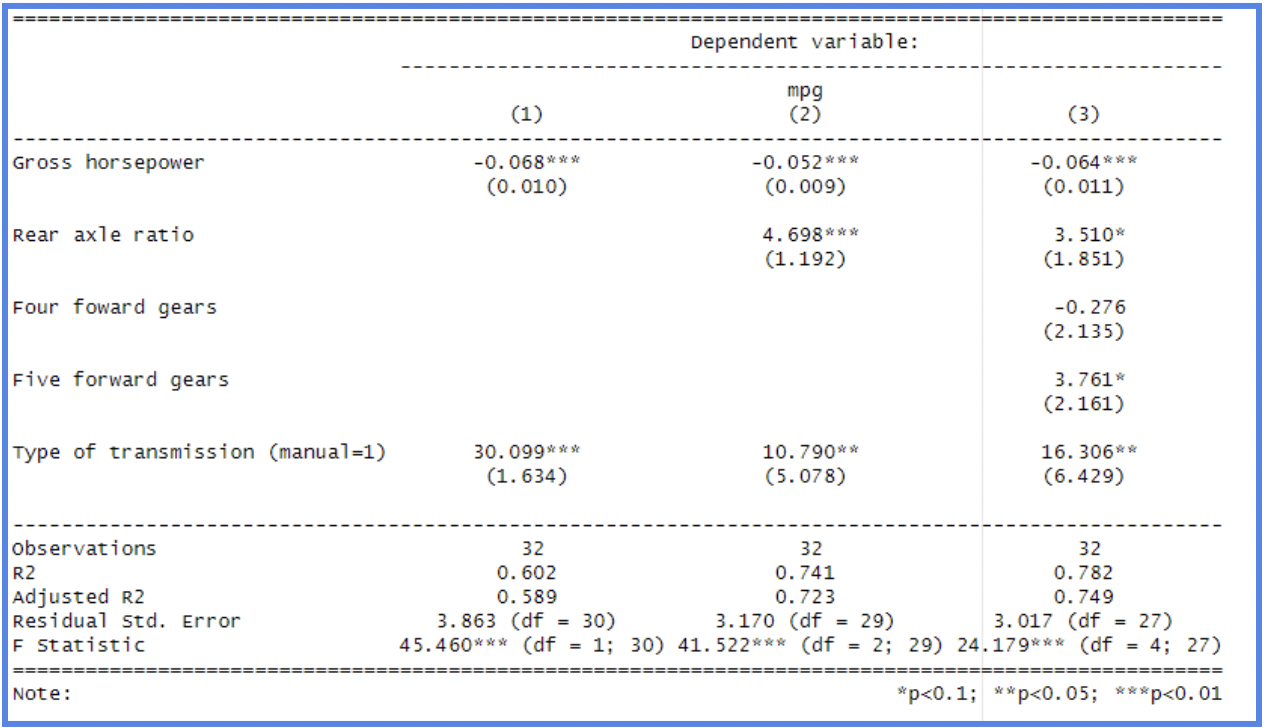
By: Sofia Covarrubias