Finding, Downloading, and Working Critically with (US) Census Data
Table of Contents
I. Thinking critically with Census data
A. What are Census data?
B. How and why were census data first produced?
C. Working with census data today: the ACS
D. A note on census geographies
E. Why thinking critically with census data matters
II. Where and how can you find and download US Census data?
A. data.census.gov
B. IPUMS
C. Social Explorer
D. Finding and downloading corresponding spatial data (boundary files)
III. Finding and downloading non-US census data
︎︎︎
I. Thinking critically with Census data
What are census data?
This workshop covers how to find, download, and think critically with data produced by the US Census Bureau, chiefly the American Community Survey (ACS). Census data, especially in the US, are one of the most comprehensive, reliable, and geographically and temporally extensive data sets available. They are well-suited to help you answer research questions related to the distribution of and relationships between demographic (meaning population characteristics, like age or sex), economic, social, and housing characteristics. Understanding and employing this kind of empirical evidence might support you as a researcher in assessing policy effectiveness or recommending policy, or telling stories about the people in a place.1
How and why were census data first produced?
When we say “Census data,” we are actually referring to a large collection of data collected and produced by the US Census Bureau beyond the decennial federal population census. The decennial census is a standalone survey conducted every 10 years that aims to count every person living in the US, their address, age, sex, and race. The decennial census was originally mandated in the US Constitution as a tool to inform the division of political power in Congress, and so the first census, in 1790, collected limited information about each person. And, instead of counting each individual, the census was conducted at the household level, so that the only individuals counted were (white male) household heads, with everyone else tallied underneath a household head.
- Indeed, research by the Census Bureau found that $2.8 trillion of federal budgeting decisions are based on census data. For example, with census data one could analyze the geographic distribution of SNAP users across a state or the country to recommend budget reallocation. Ceci Villa Ross, “Uses of Decennial Census Programs Data in Federal Funds Distribution: Fiscal Year 2021,” Census.Gov, accessed July 31, 2025, https://www.census.gov/library/working-papers/2023/dec/census-data-federal-funds.html. ↩
- Margo J. Anderson, The American Census: A Social History, 2nd ed. (New Haven, CT: Yale University Press, 2015), 1Margo J. Anderson, The American Census: A Social History, 2nd ed. (New Haven, CT: Yale University Press, 2015), 15. Indeed, research by the Census Bureau found that $2.8 trillion of federal budgeting decisions are based on census data. For example, with census data one could analyze the geographic distribution of SNAP users across a state or the country to recommend budget reallocation. Ceci Villa Ross, “Uses of Decennial Census Programs Data in Federal Funds Distribution: Fiscal Year 2021,” Census.Gov, accessed July 31, 2025, https://www.census.gov/library/working-papers/2023/dec/census-data-federal-funds.html. ↩
Working with census data today: the ACS
The Census Bureau has grown in response to Americans’ statistical demands. However, detailed data are now captured in a survey called the American Community Survey (ACS), rather than the decennial census. Beyond the demographic, economic, social, and housing characteristics captured in the census, the Census Bureau also produces other topically detailed surveys like the American Time Use Survey, American Housing Survey, Current Population Survey, and a variety of economic and governmental censuses. The ACS collects a wide variety of population information but for a smaller number of sampled households across the country, every year, creating more continuous and detailed data than the decennial census.
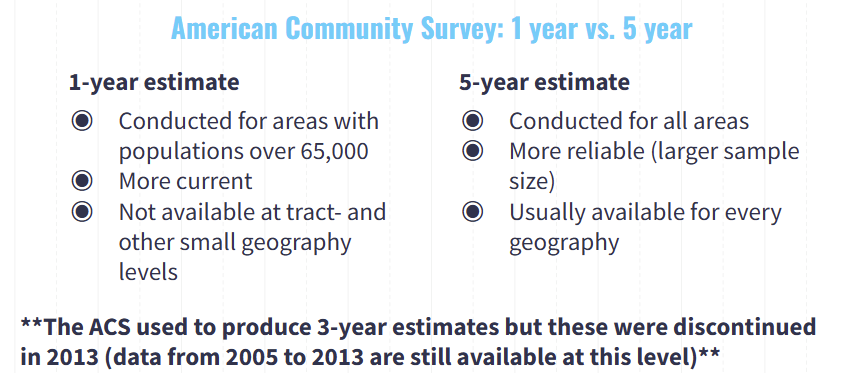
Because the ACS collects data from a select number of sampled households across the country, they average data over a period of time to increase their sample size and the accuracy of their data (this is referred to as a period estimate). The ACS creates both 1- and 5-year estimates. When working with ACS data, it is important to consider the tradeoffs between data timeliness and comprehension. Since less people are sampled in smaller municipalities and at smaller census geographies, the ACS needs to pool and weight data in these places over a longer period of time to create accurate data. Therefore, only 5 year estimates are available for small geographies and municipalities with less than 65,000 people. However, these data provide a less recent snapshot of population characteristics because they are collected over a 5 year period.
A note on census geographies
The census is fundamentally a geographic enterprise – Congress needs to be able to locate people precisely in order to draw the bounds of political power. And, it is helpful to know who is located where in order to most equitably and effectively distribute resources. As such, the ACS attaches each respondent’s data to an address. However, for the most part, person-level data are not accessible to researchers as the Census Bureau maintains strict confidentiality requirements. Instead, in order to make data accessible to the public, the census aggregates data up to larger boundaries (or what are often referred to as census geographies) to maintain anonymity and to provide structure to its data.
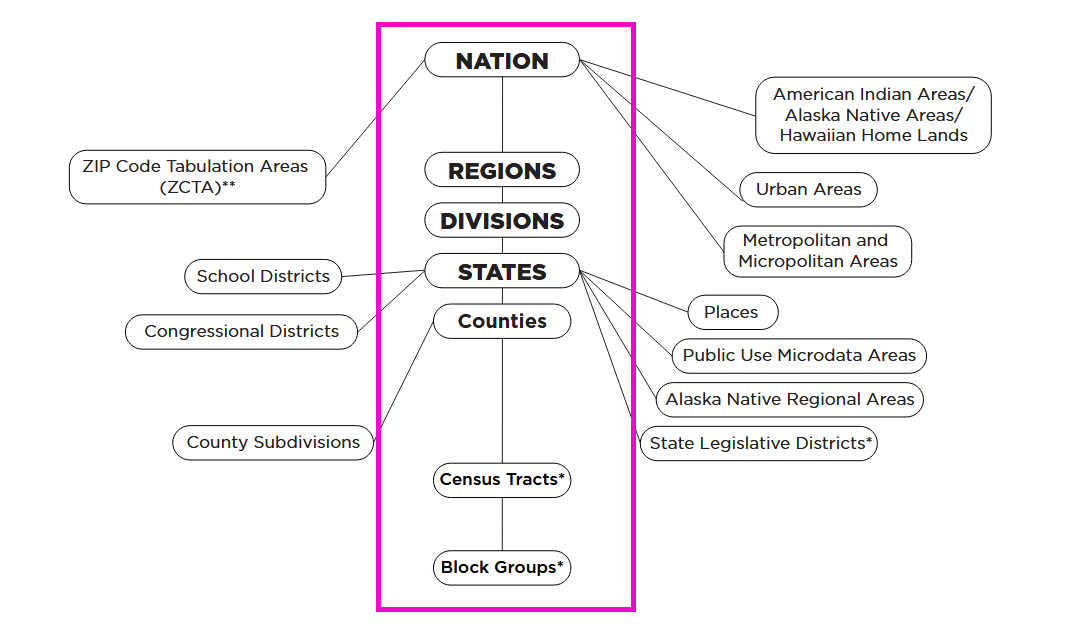
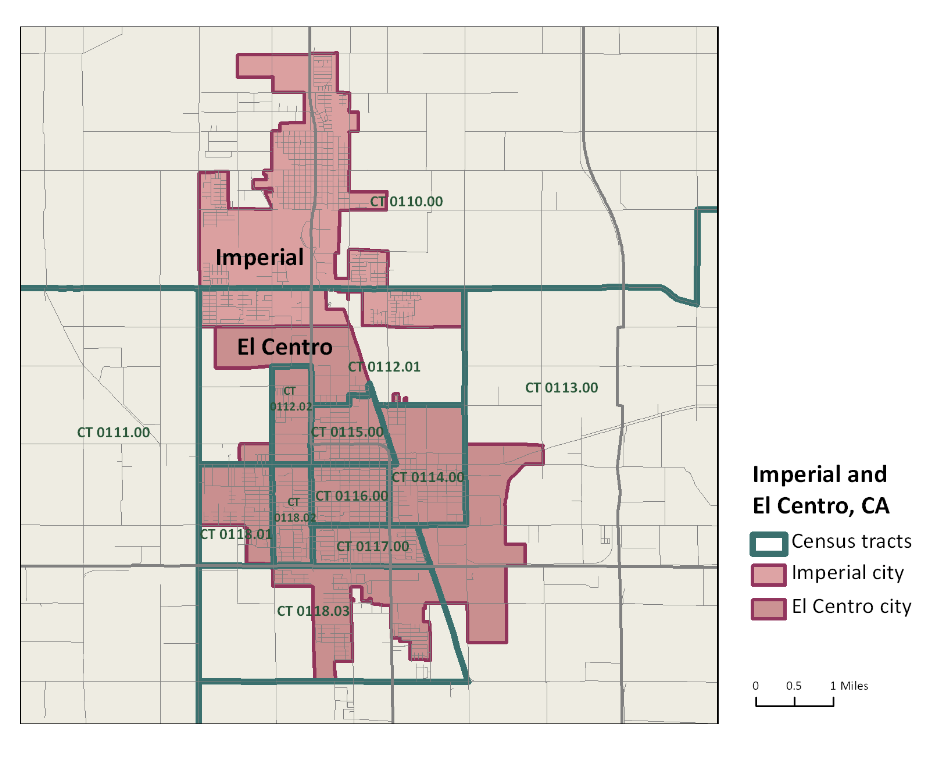
The Census Bureau maintains an established geographic hierarchy, highlighted in the image above, for aggregating data geographically. However, as the chart shows, some geographies nest within some geographies but not others. The example below shows how census tract and urban area boundaries conflict in El Centro, California. In this case, if you want your analysis to focus only on El Centro, you would likely want to download census data for the El Centro city geography rather than at the census tract level. In general, when thinking about what geography to use, consider
- How geographic scales and boundaries influence your process of interest. For example, it can make sense to study and map political behavior at the scale of political boundaries (ex. Congressional or state legislative districts) because political boundaries are designed to organize and structure our political behavior.
- In other cases, you should aim for as precise a scale of geographic analysis you can get without compromising data availability and overtaxing your computational resources. Smaller scales help you understand spatial phenomenon with specificity and lessen the Modifiable Areal Unit Problem.
Why thinking critically with census data matters
We start with this history and context because it gives us insights into the strengths and weaknesses of census data as an empirical source. With the resources and backing of the federal government (it is technically a federal crime to not respond to the census or ACS), the census has unparalleled geographic reach, temporal scope and continuity, reliability, and accuracy when it comes to demographic data. However, as we have seen, the Census Bureau makes choices about structuring and limiting its data and it is important to consider how these factor into your research.
History also shows how the census is an inherently political tool; its data are constitutionally rooted in declaring and testing the bounds of political power. As a dataset whose intent is to provide a representative picture of America, the structure of the census -- who it aims to include and how it categorizes them -- is both unintentionally and deliberately used to include and exclude people, which is important to keep in mind when creating demographic research questions. Before beginning research with the census, consider how people often underrepresented in the census (incarcerated people, people experiencing homelessness, non-English speakers, undocumented immigrants, college students, other people with more than one address or who live in different places at different times of the year) factor into your research and story.
Where can you find and download US Census data?
These next sections will cover how to find ACS data from
- data.census.gov, the interface for census data download developed by the Census Bureau
- IPUMS, a project run by the University of Minnesota which aims to create data operable across censuses.
- Social Explorer, which is a data download interface developed and maintained by a private company
Before we get into the research question this guide to downloading data is modeled afterwards, let’s first demystify some of the jargon used to talk about census data.
Glossary
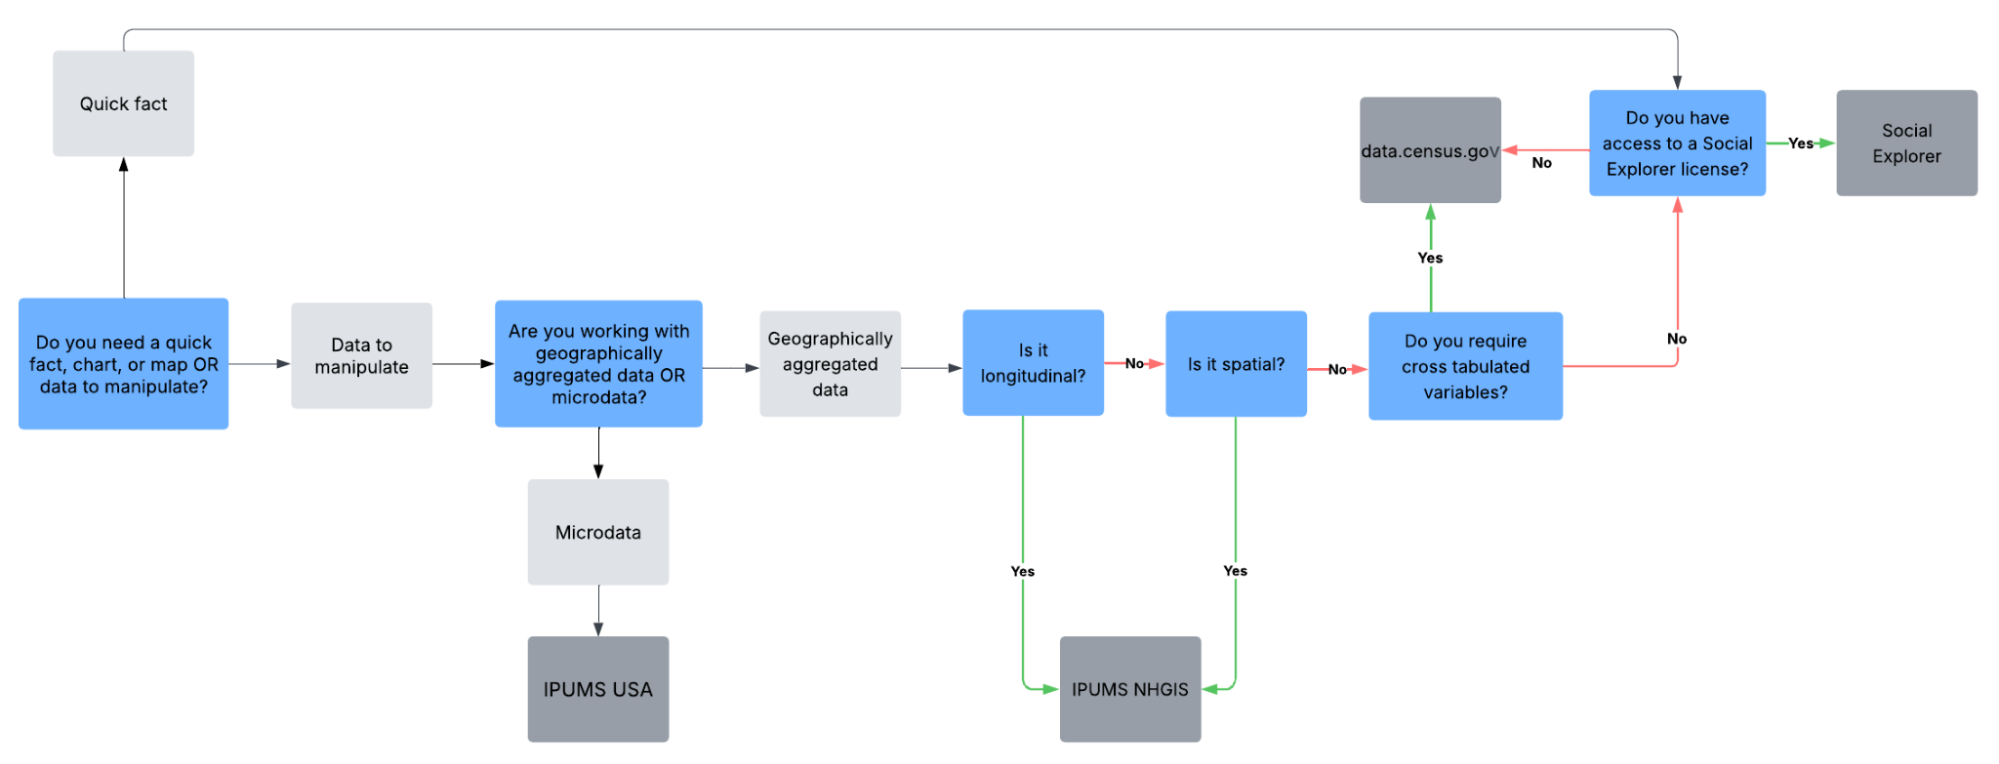
- Microdata: census data preserved at the level of the individual respondent. Microdata are governed by very specific anonymity rules, sometimes making them more complex to access and work with. Make an appointment with us if you are working with microdata and run into questions or issues!
- Geographically aggregated data: census data tabulated into larger geographies like tracts, counties, or states -- how most people traditionally interact with census data.
- Longitudinal variable: variables linked across time for consistency
- Cross tabulated variable: observations at the intersection of two variables ex. Analyzing “means of transportation to work by age” rather than just “means of transportation to work” and “age” separately
Specifically, we will be looking for data to help us answer the question “How did commute mode vary by neighborhood in New York City in 2023?” You are welcome to follow directly along with this guide by downloading the same data, or if you have already identified a research question that requires using census data, you can mirror the steps of this guide based on your own data needs.
Following the critical discussion above, let’s decide the geographic and temporal scope of our research question before we begin.
To be able to draw out patterns between income and means of transportation to work, we want as fine-grained of data as possible, meaning we will use census tracts as our unit of geography. We will download census tracts from each borough of NYC, which is also a county: Brooklyn (Kings County), Queens (Queens County), Bronx (Bronx County), and Staten Island (Richmond County).
Since we want to work with census tract data, we will use 5-year ACS estimates, from the most recent 2019-2023 sample to answer our question.
data.census.gov is the interface created by the Census Bureau itself for finding and downloading census data.

Follow along finding our variable of interest, subsetting to get our specific geographic and temporal scope, and downloading the data using the sequence of screenshots or the one-shot video below.
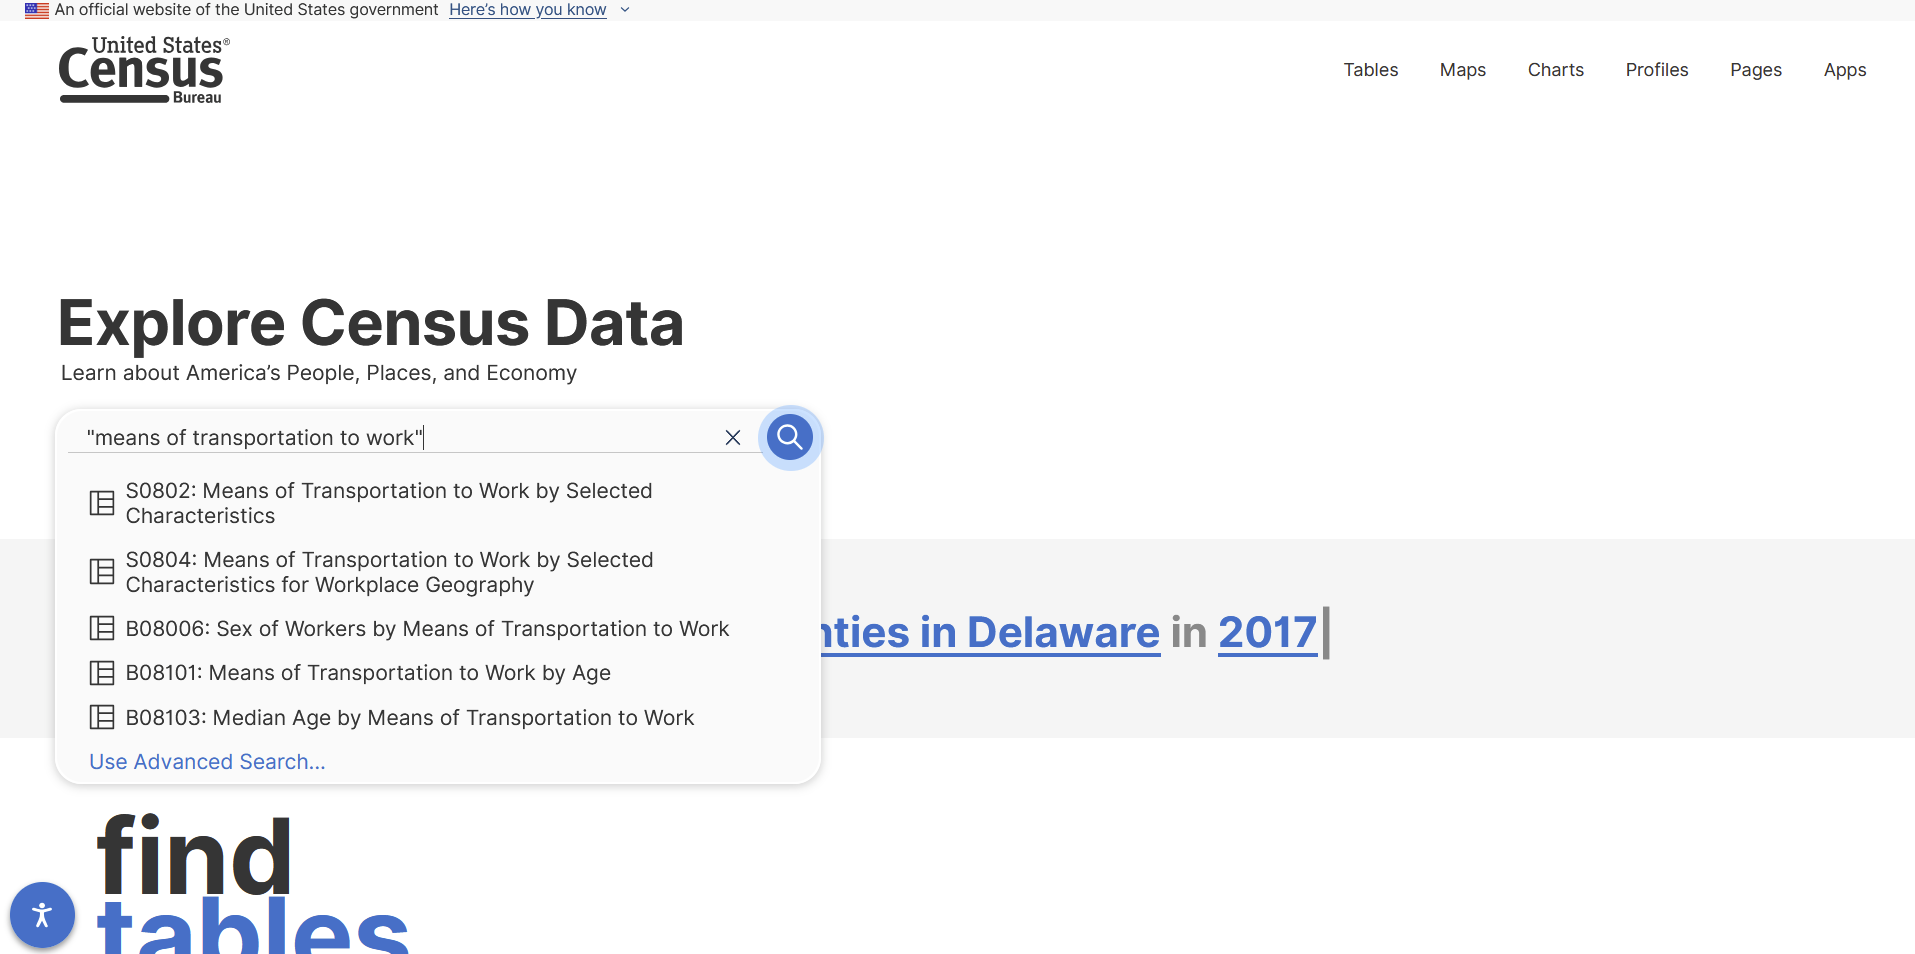
- Open data.census.gov
![]()
- Search “means of transportation to work.” If you know what your exact variable is, type it in with quotes to limit search returns. Skip the quotes if you don’t know exactly what you’re looking for or are still searching for variables of interest.
3. A lot of possible data will pop up, although we see our variable of interest -- “B08301 | Means of Transportation to Work” is first. Let’s filter to get the data exactly as we want.
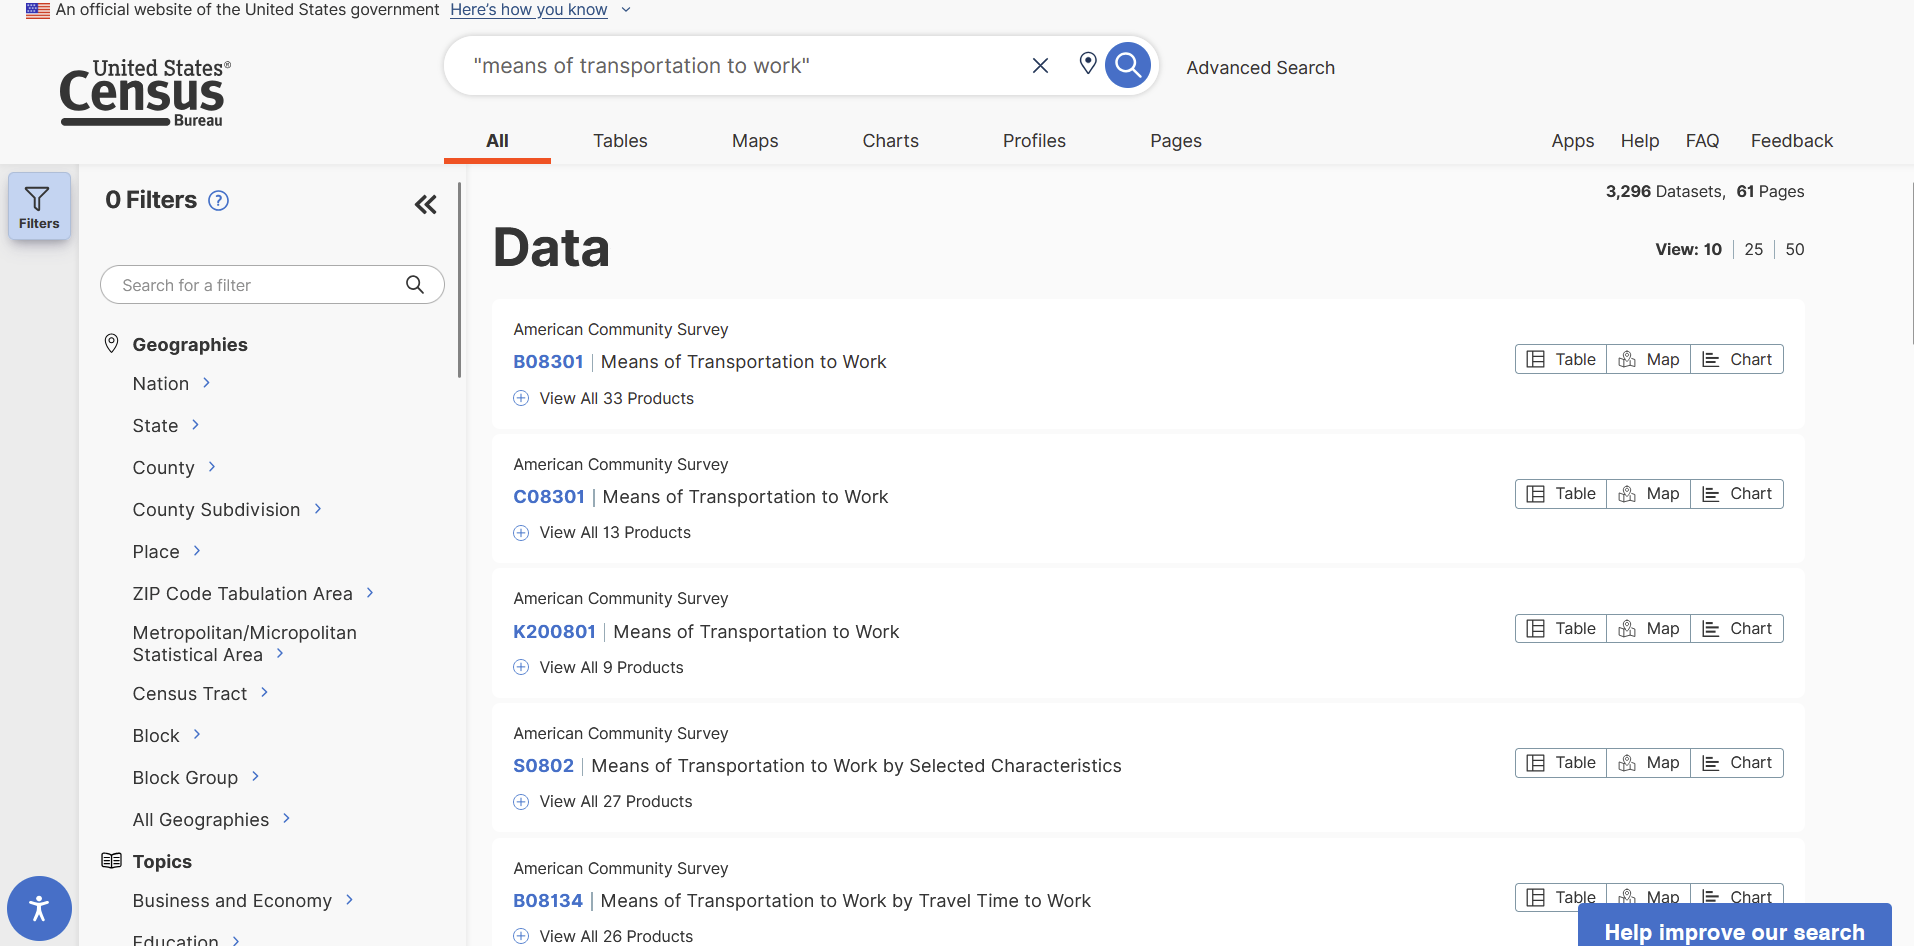
4. First, we’ll filter by geography. We will select census tracts from every county in New York and filter down to New York City later because it would be annoying to have to do this 5 times.
- Now, we’ll confirm that the “B08301 | Means of Transportation to Work” is available for the census product we want -- ACS 5-year estimates for 2019-2023 -- and download data for that year. Upon download, we can explore the metadata to figure out how to interpret the columns in the CSV.
IPUMS
IPUMS is a project housed at the Institute for Social Research and Data Innovation at the University of Minnesota focused on making government data “interoperable across time” and space to facilitate longitudinal research. Longitudinal research means any question that follows the same variable across time.

In the following screenshots or video, we locate our “means of transport” as a source variable (meaning it comes directly from one census, rather than being a longitudinal variable harmonized across multiple censuses or surveys), then select cases that fall within our geographic area of interest, and then download the data.
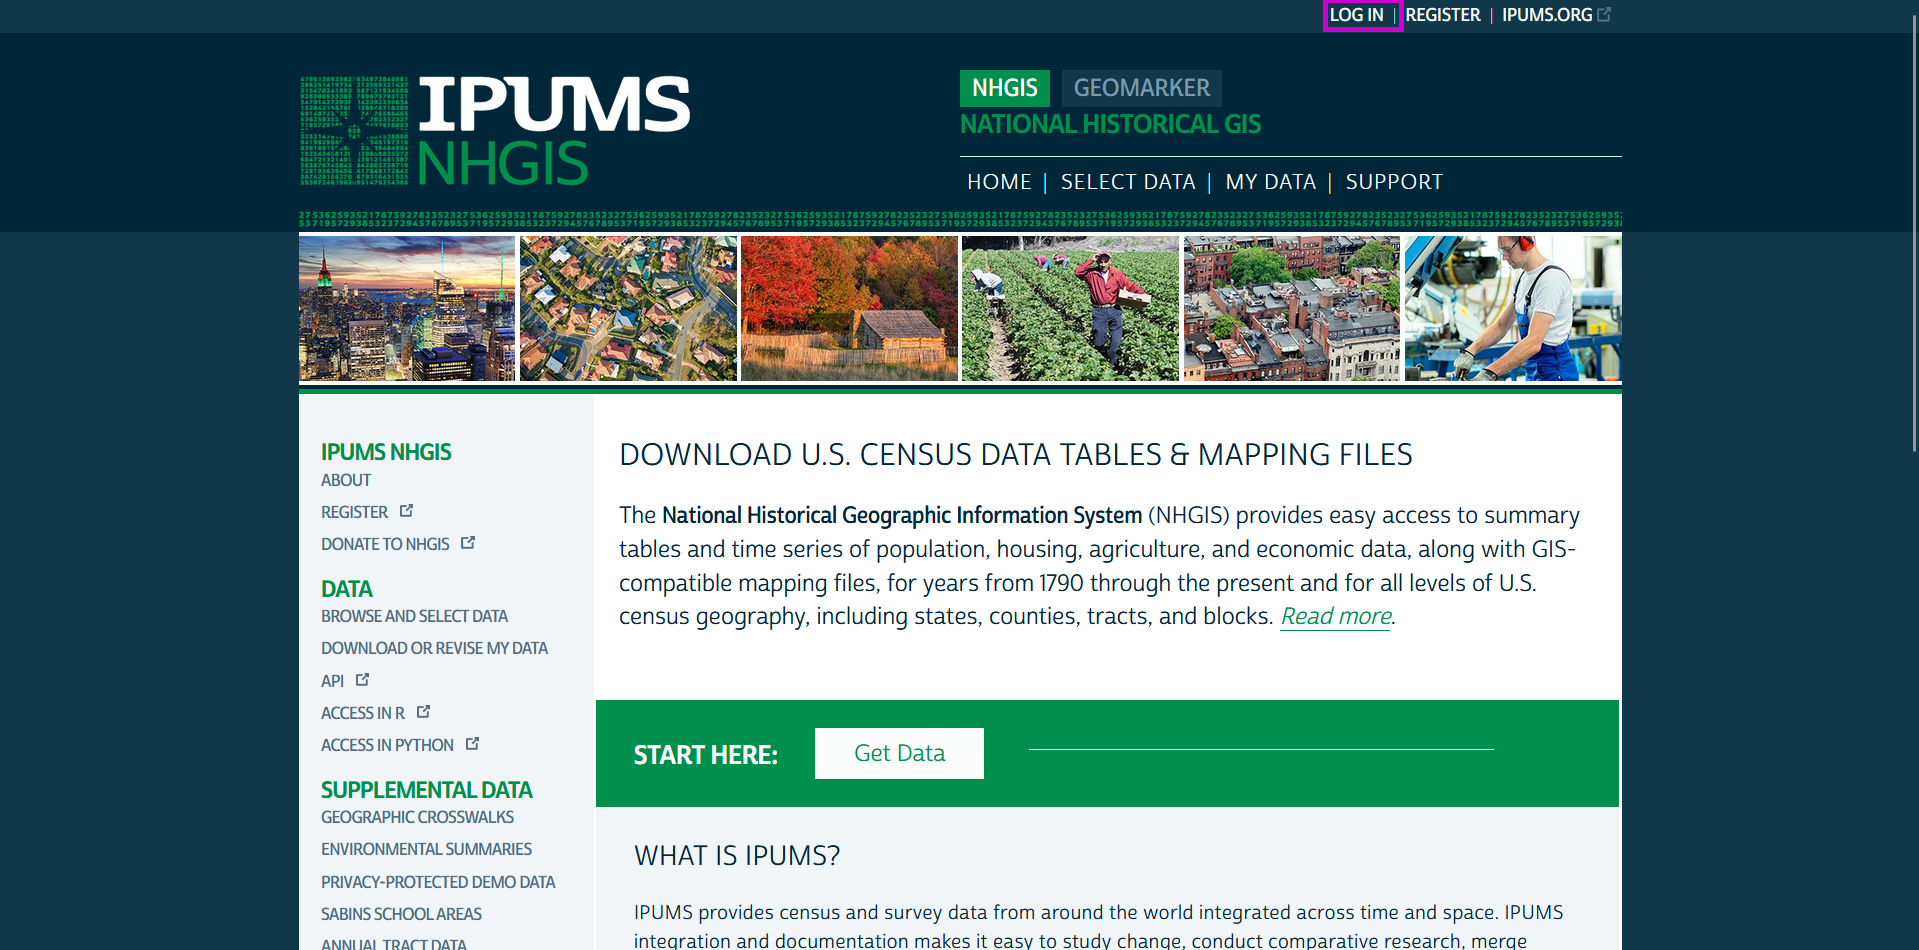
1. Go to nhgis.org. First, you will need to make an account if you want to eventually download data. You can register as a new user here, and then you log in the top right corner of the page as highlighted below.
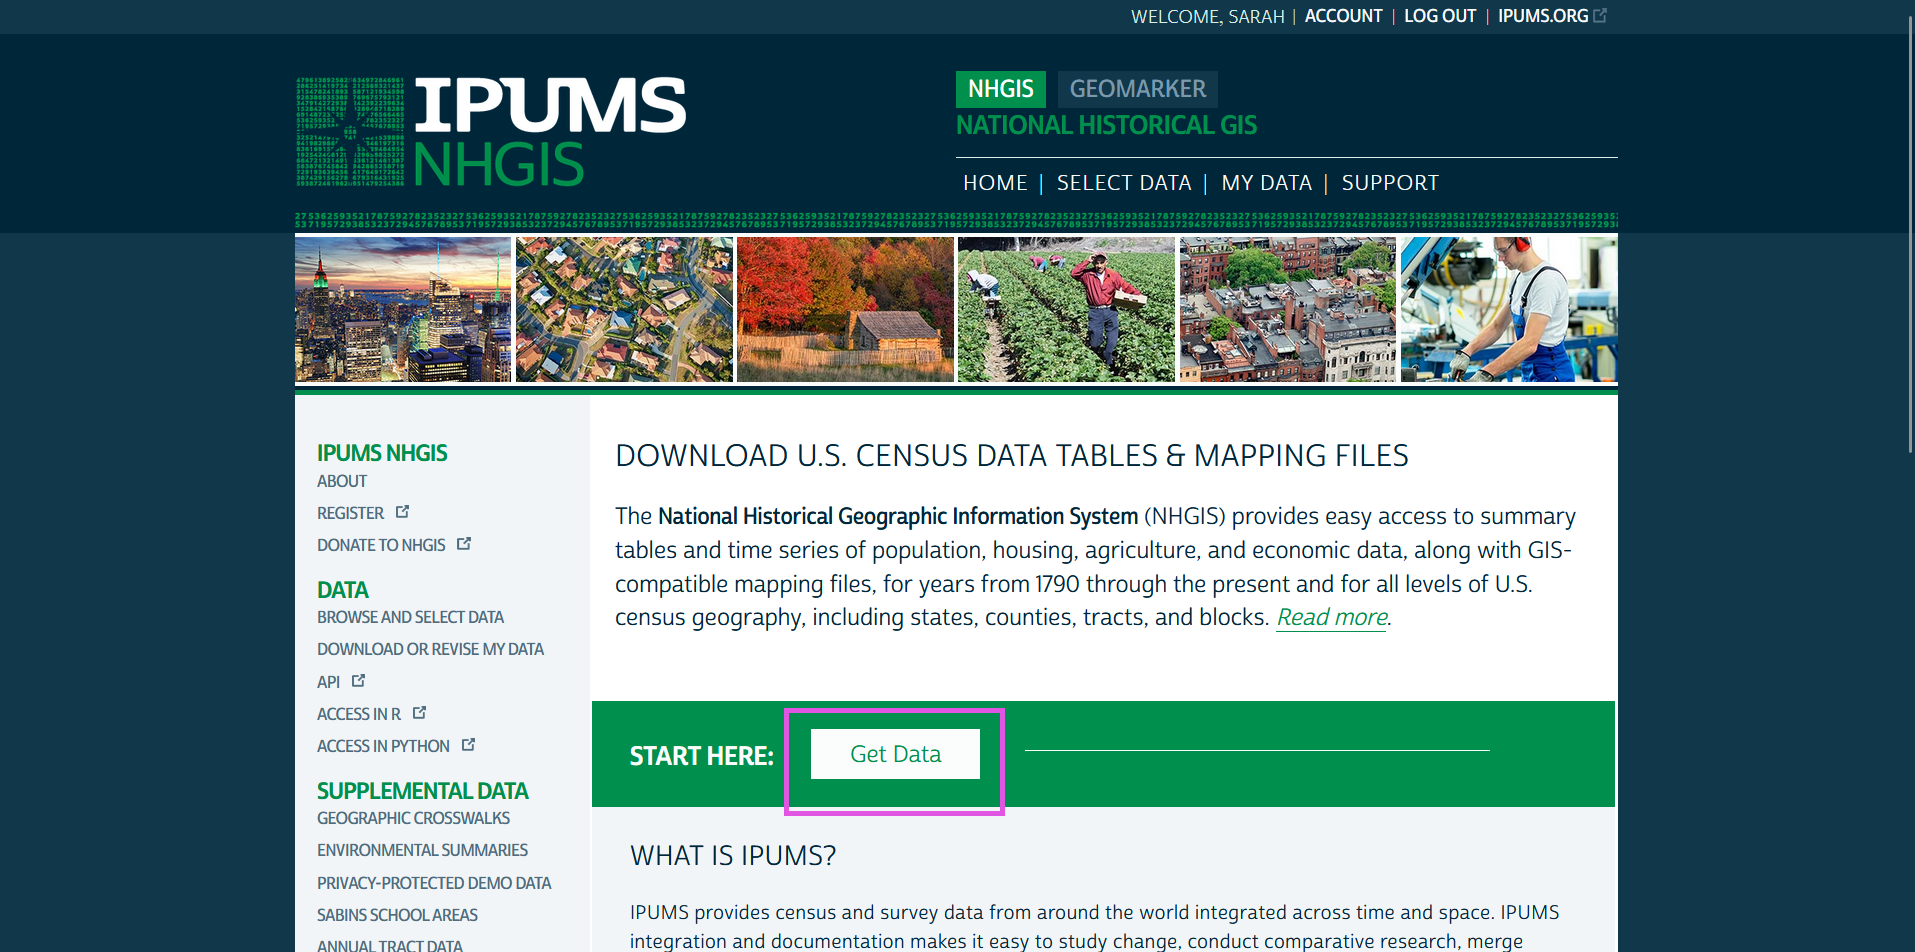
2. click on “Get Data” to get taken to the search menu.
3. We will need to filter our data to find our variables, samples and geographies of interest. First, let’s filter by topic.
4. Next, let’s filter by time, selecting the most recent ACS 5-year period as per the decisions we made during our research design.
5. After adding the time filter, we can see our variable of interest -- “B08301 | Means of Transportation to Work” -- is near the top. Let’s add one more filter by geographic level -- tract -- before we download our spatial and tabular data.
6. Finally, let’s click on our results in each tab to add the source table and GIS file to our “Data Cart” for download.
7. In our data cart, let’s filter down to tabular data just for New York State to make our download more manageable.
8. Finally, let’s continue on to review and submit our selections and proceed to download them. When selecting your download structure, keep it in CSV format for GIS compatibility, and leave it in all one file for ease of download. Best practice is to add a description to make it easier for you to go back and replicate your process.
9. When your data have finished extracting, you can download your table data, metadata, and GIS files from your extracts history. This short clip shows how to download the data, unzip it (for Windows users ONLY), and explore the metadata to figure out how to interpret the columns in the CSV.
Social Explorer
Social Explorer is a private company that creates a license-restricted, intuitive user interface for downloading mainly ACS and historical census data.

In the following video, we locate our data product of interest (the 2023 ACS), then subset by our geographies of interest, select “means of transport” as our variable of interest, and finally download our data.
Finding and downloading corresponding spatial data (boundary files)
If you download data from data.census.gov or Social Explorer, you will only get data tables, and none of the corresponding spatial information. In that case, you can download the geographic boundaries created by the Census Bureau for data collection through a Census software called TIGER, as shown in the short clip below.
Keep in mind that tabular joins in GIS (like those used to combine ACS attribute data and census tract shapefiles) requires the columns being joined together to be the same data type. You can find a tutorial on how to wrangle data types for successful joins here.
Finding and downloading non-US census data
Most countries globally conduct some form of census. Going back to our earlier discussion of census history, censuses are an imperfect but still comprehensive starting point for demographic research. IPUMS International combines and links international census data like it does with US census data. You can also find a (quite comprehensive) list of the websites of various countries’ national statistical agency, which you can use to see if and where their census data is disseminated online in these guides compiled by Penn State, the Ivy Plus Libraries Confederation, the Census Bureau, and the United Nations.
By: Sarah Baybeck
By: Sarah Baybeck