From STATA to Report:how to create output tables using
Outreg 2
In this tutorial:
- What is outreg2 and why should we use it?
- Summary tables
- OLS regression result tables
What is outreg2?
The outreg2 command produces output tables that resemble those reported in journal articles. Output tables presented in Stata result windows can be saved in Word, Text, or Excel files using the outreg2 command.
Before using the outreg2 command, we need to install it first because it is a user-written command. Remember, if you install it once, you will not need to install it again.
To install the command, type:
Stata
ssc install outreg2Example Dataset: National Longitudinal Survey
For this guide, we will use the nlswork dataset to demonstrate how outreg2 exports summary statistics and regression results. The National Longitudinal Survey of Young Women (NLS-YW) is a long-term U.S. study that began in 1968, tracking 5,159 women aged 14–24 over several decades to collect data on their work, wages, education, and family life. In Stata, the built-in nlswork dataset is a simplified version of this study, widely used in econometrics and labor economics teaching.
Stata
*Load it in by running this command:
webuse nlswork, clear
1. Descriptive Statistics
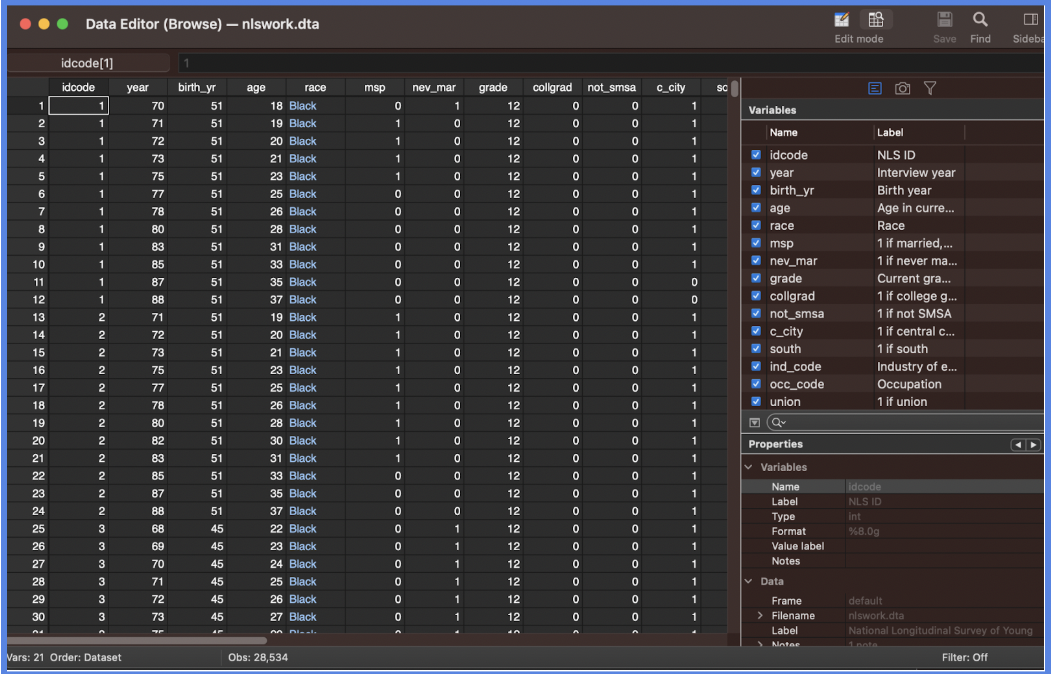
To see what variables are available use the describe and browse variables to observe your data. 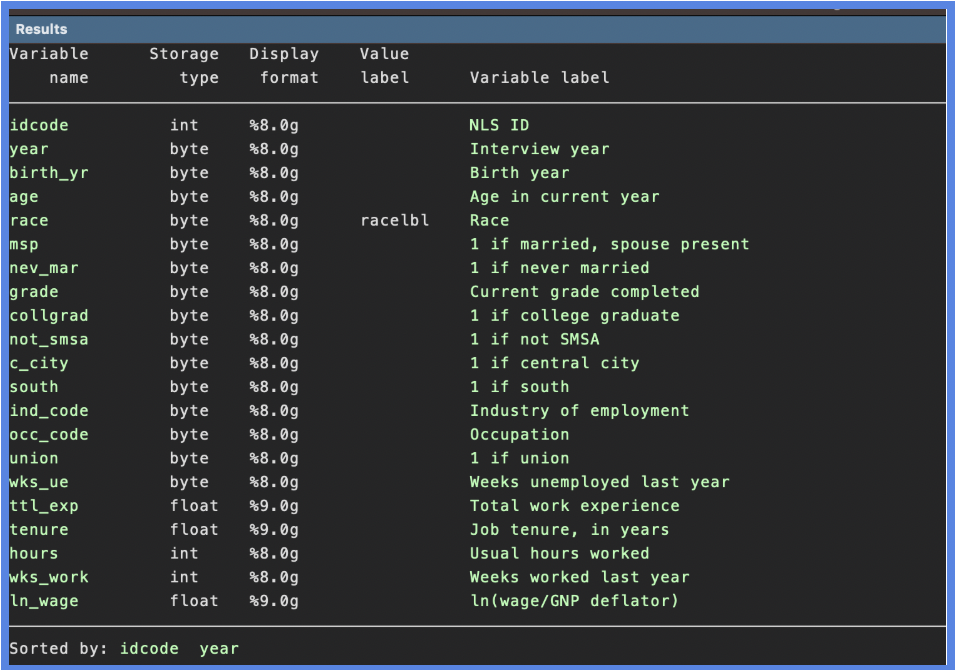
You can quickly generate a clean summary statistics table for your dataset with the following line of code:
outreg2 using filename, sum [options (replace file type)]
Explanation of parts
| Command/Option | Description |
|---|---|
| using summary.doc | File name (you can change it) |
| sum | Tells outreg2 to create summary statistics |
| replace | Overwrites the file if it already exists |
| File type | Output as Word, Excel, or txt |
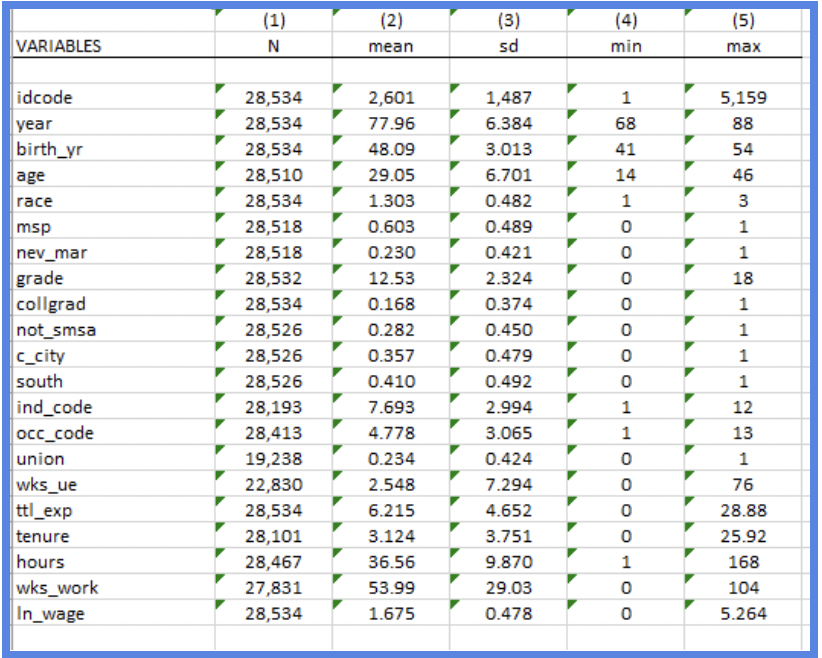
This command produces a formatted table showing key descriptive statistics such as mean, standard deviation, min, and max for each variable in your dataset—ideal for reports or presentations.
Save as Word document (.doc):
Stata
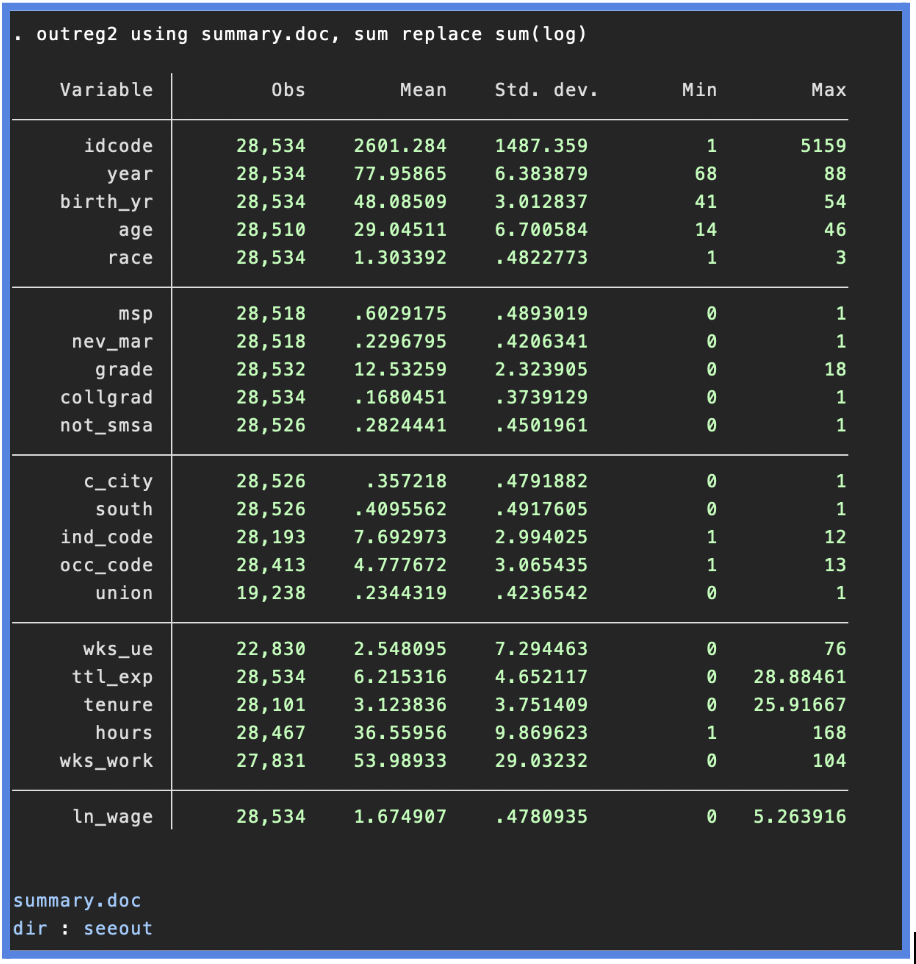
outreg2 using summary.doc, sum replace sum(log)We will get the following outputs in the Stata output window.
If you are a Windows user, click on sumstat.doc to open the file myreg.doc in Word (you can replace this name with your own).
If you are a Mac user, click on dir to go to the directory where sumstat.doc is saved, and open it with Word (you can replace this name with your own).
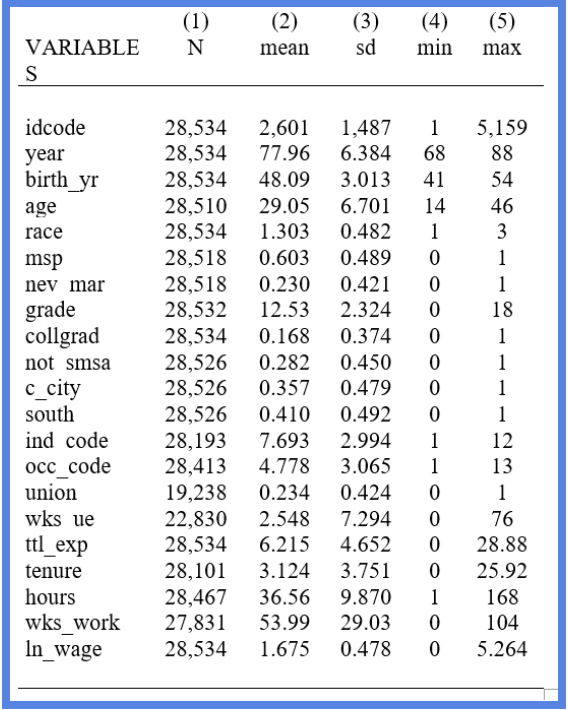
The summary stat outputs in the Word file will look as follows.
If you are a Mac user, click on dir to go to the directory where sumstat.doc is saved, and open it with Word (you can replace this name with your own).
The summary stat outputs in the Word file will look as follows.
NOTE: The part
In other words:
sum(log) tells outreg2 to report the summary statistics in log form — but only for variables that were already log-transformed.In other words:
- If you have variables like
ln_wage(which is already the log of wage), it will report the summary stats as they are. - But if you have non-log variables and use
sum(log), it will apply a log transformation before summarizing — e.g.,log(age),log(tenure).
To save as an Excel and text file use the following:
Save as Excel file (.xls):
Save as Excel file (.xls):
Stata
outreg2 using summary.xls, sum replace sum(log)
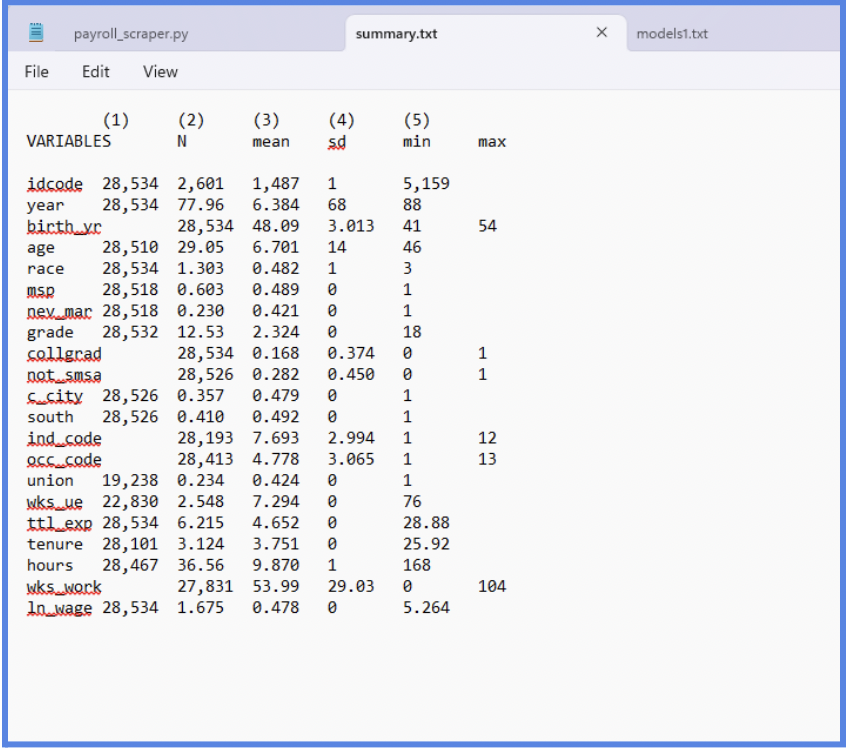
Save as plain text file (.txt):
Stata
outreg2 using summary.txt, sum replace
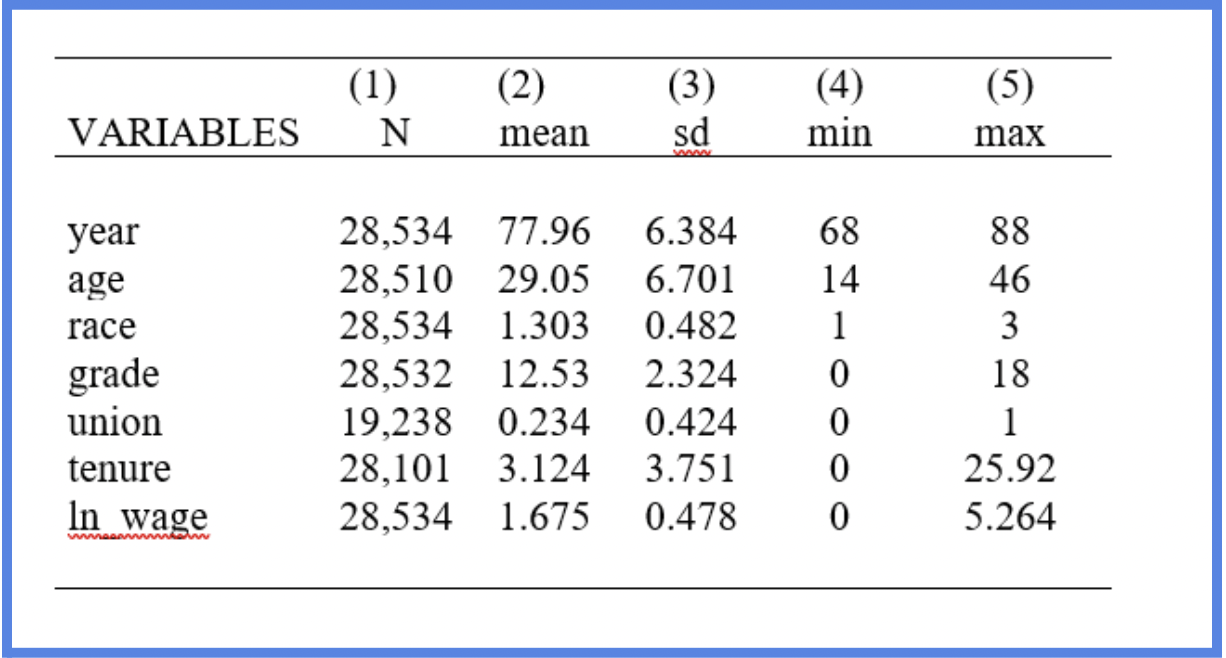
2. Limit to specific variables
If you only want certain variables, list them before the command:
Stata
outreg2 using sumstat2.doc, replace sum(log) keep (year age race grade union tenure ln_wage)
NOTE: Be sure to check your working directory to know where Stata is saving your tables.
You can do this using the command
pwd, or change the working directory with:
"C:YourFolderPath"
3. Linear Regression Tables
You can use Outreg2 to generate clean OLS regressions result tables and save them directly in your word or browser viewing.
Through this line of code you can fit your regression and create the outreg table output:
Stata
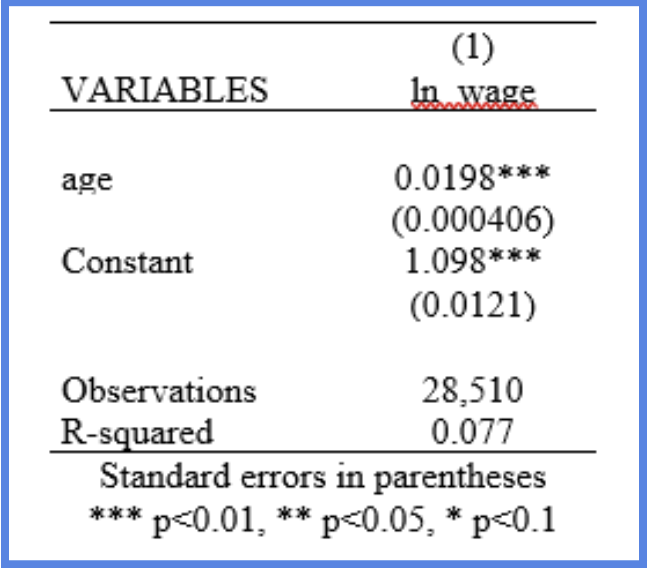
reg ln_wage age
outreg2 using reg1.doc, replace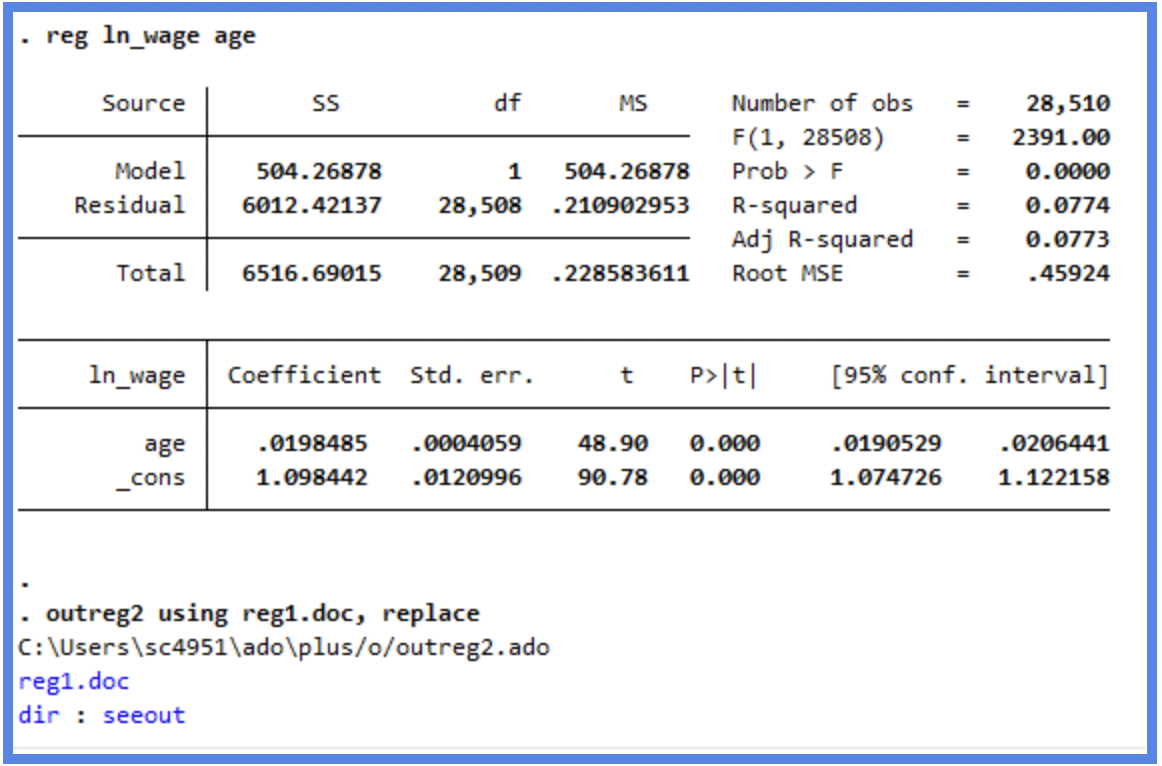
Output in Word
![]()
Outoput in txt
![]()
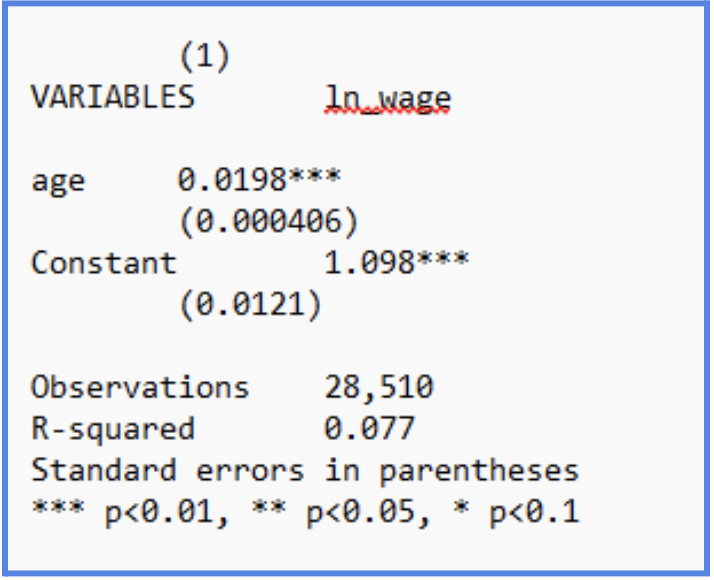
We can see that the table shows the coefficients and its standard error(in the bracket underneath the coefficients). Also, the level of significance is displayed as well, by the number of *. It also shows the observation number, R-square and Adjusted R-squared.
Note: The red underlines you may see are just spell-check highlights from your text editor or document software. They're not actual errors—just flagged terms like statistical symbols or technical names.
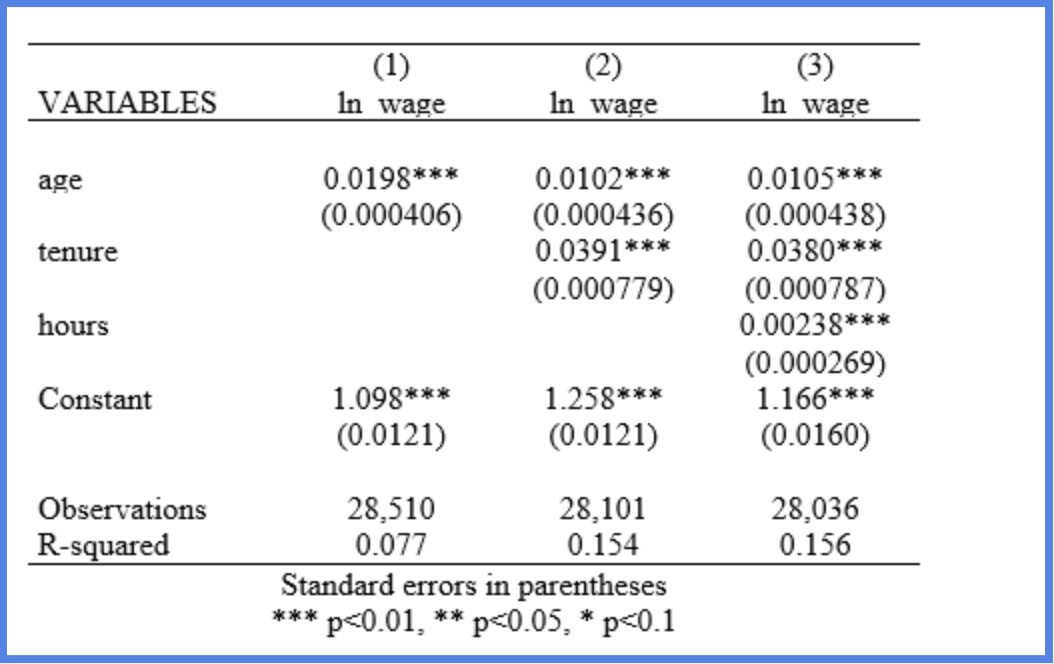
4. Linear Regression Multiple Models
When we want to compare multiple regression models and assess their results and significance, we can use the outreg2 package to report them clearly.
Stata
reg ln_wage age
outreg2 using models.doc, replace

reg ln_wage age tenure
outreg2 using models.doc, append

reg ln_wage age tenure hours
outreg2 using models.doc, append
As observed above you must change the “replace” to “append” in order to get the additional models included.
Note: To add multiple regression models side-by-side in the same table, make sure to use
append after the first replace.
Once you generate the tables using outreg2, you can easily add titles, change variable names, and modify or reorder variables directly in the output file (e.g., in Word or Excel). These edits can also be automated through Stata code by adjusting variable labels or using additional formatting options.
For more advanced customization and examples, look here: Outreg2 Help File on SSC
For more advanced customization and examples, look here: Outreg2 Help File on SSC