How to append and merge datasets in stata
How to append and merge datasets in stata
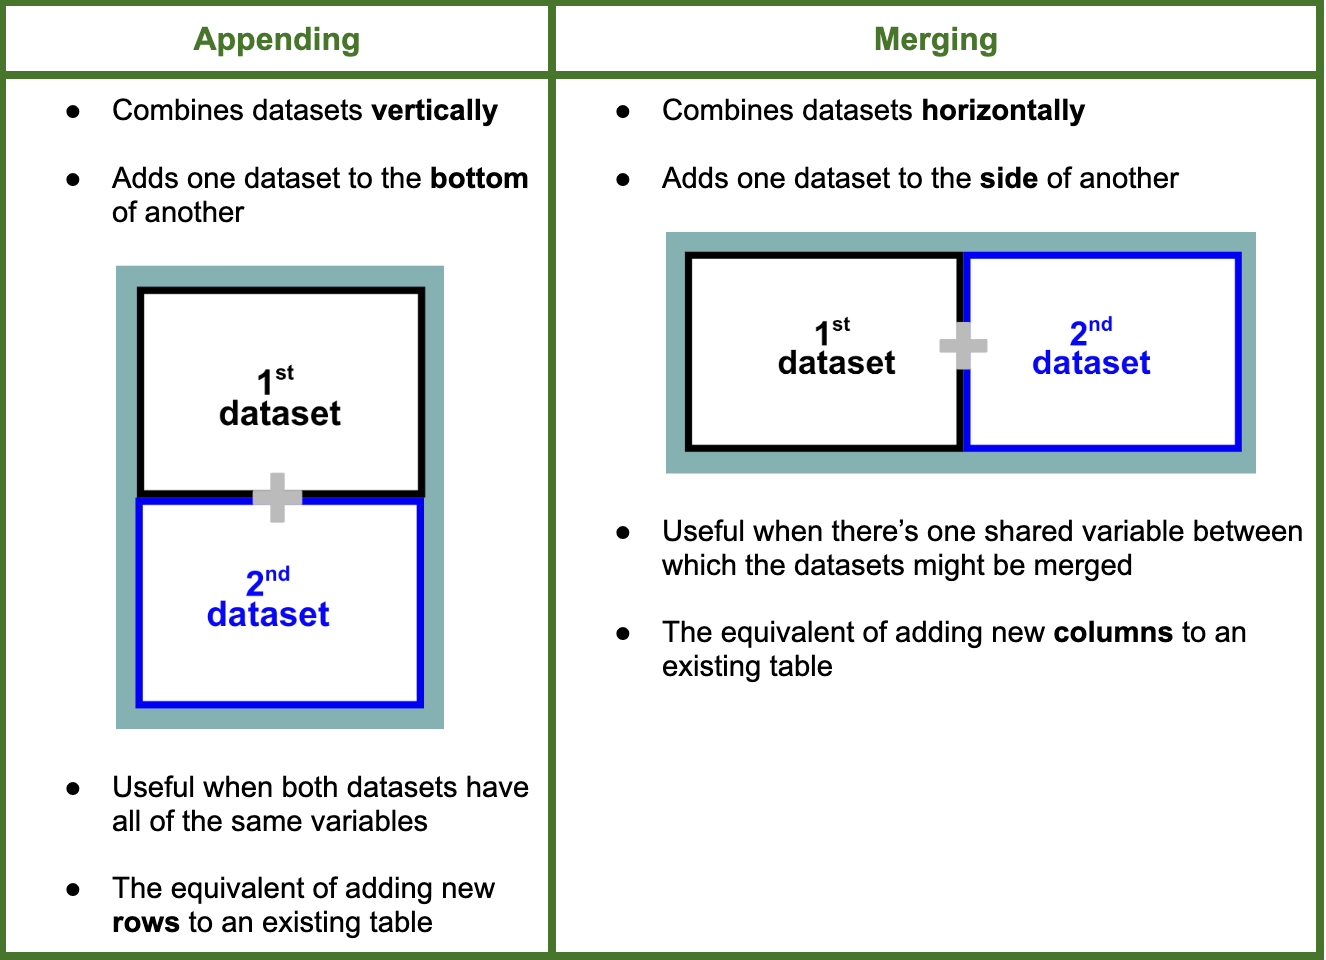
Welcome to the Stata Guide on appending and merging datasets in Stata! These are two different ways of combining multiple datasets into one.
Throughout this guide, blue phrases will be used to indicate commands, green phrases for variables, and purple for links and downloads.
We’ll be using altered versions of what was originally a singular NYCOpenData’s Film Permits dataset (here is the link to the original). The four datasets on which we’ll be practicing the concepts of appending and merging can be found here.
Here is the .do file which you can use to follow the guide with.
What’s the difference between appending and merging datasets?
Appending Datasets
Let’s begin by loading in the first dataset onto which we will be appending the other which is labeled, ‘film-append-1.dta’.
Once we see that the data has been loaded in, we can make note of some quick facts about the dataset which are listed under the Properties tab.

There are 15 variables (or columns) included in the dataset and 6,193 observations (or rows) per variable. Since appending adds information to the bottom of the current sheet, we should expect there to be more rows once we have done so.

Scrolling to the bottom of the spreadsheet when browsing, we can make note of the observations at the bottom of the current sheet.
Let’s now append by running the following:
append using film-append-2.dtaOnce we see that the data has been loaded in, we can make note of some quick facts about the dataset which are listed under the Properties tab.
There are 15 variables (or columns) included in the dataset and 6,193 observations (or rows) per variable. Since appending adds information to the bottom of the current sheet, we should expect there to be more rows once we have done so.
Scrolling to the bottom of the spreadsheet when browsing, we can make note of the observations at the bottom of the current sheet.
Let’s now append by running the following:

We can now see that the Properties tab has been updated accordingly to account for the adjustments we’ve made to the dataset.

Viewing the previous bottom of the spreadsheet shows us some of the additional rows that have been appended.
There are about double as many observations (or rows) within our dataset. Next, we can save this appended dataset and move on to learning how to merge datasets with one another.
Let’s begin by loading in the first dataset onto which we will be appending the other which is labeled, ‘film-merge-1.dta’.
Once we see that the data has been loaded in, we can make note of some quick facts about the dataset which are listed under the Properties tab.

There are 8 variables (or columns) included in the dataset and 12,388 observations (or rows) per variable. These 8 variables are, eventid, startdatetime, enteredon, parkingheld, eventtype, enddatetime, eventagency, and borough.
Since merging adds information to the side of the current sheet, we should expect there to be more columns once we have done so.
Let’s now merge by running the following:
Viewing the previous bottom of the spreadsheet shows us some of the additional rows that have been appended.
There are about double as many observations (or rows) within our dataset. Next, we can save this appended dataset and move on to learning how to merge datasets with one another.
Merging Datasets
Let’s begin by loading in the first dataset onto which we will be appending the other which is labeled, ‘film-merge-1.dta’.
Once we see that the data has been loaded in, we can make note of some quick facts about the dataset which are listed under the Properties tab.
There are 8 variables (or columns) included in the dataset and 12,388 observations (or rows) per variable. These 8 variables are, eventid, startdatetime, enteredon, parkingheld, eventtype, enddatetime, eventagency, and borough.
Since merging adds information to the side of the current sheet, we should expect there to be more columns once we have done so.
Let’s now merge by running the following:

This will generate a table in Stata’s Display window which looks like this:

We know that the merging has been successful since the table indicates that there are zero results which are left without matches and that all 12,388 observations have been matched.

Additionally, we can observe that the Data tab under Properties has been updated to indicate that the adjusted dataset contains 15 variables whereas film-merge-1.dta only contained 8. Let’s browse to see the new variables/their respective columns which have been added to the first sheet.

The diagram above has the new variables marked with blue asterisks. We can see that the columns of the second sheet have been successfully merged with the first sheet through using the eventid variable.
Congrats on making it to the end of this Stata guide!
For more How-Tos on using Stata see here:
By: Zoe Pyne
Congrats on making it to the end of this Stata guide!
For more How-Tos on using Stata see here:
- How to: Reclassifying Variables in Stata
- How to: Create Multiplots in Stata
- How to: Clean Survey Data in Stata
- How to: Use Multiple Frames in Stata
By: Zoe Pyne