Getting Started With Your First QGIS Project
This guide provides a complete walkthrough of a standard project workflow using QGIS. Our goal is to analyze and map median gross rent in Manhattan. This will involve sourcing data, preparing it for analysis, performing a spatial operation, and designing a final map for export.
1. GIS Fundamentals
Before we start, let's cover two concepts that are essential for any GIS project.
Data Types
Geospatial data comes in two main forms:
Vector: This type of data represents real-world features as distinct shapes such as points (for things like trees), lines (for roads or rivers), and polygons (for areas like buildings or parks). We'll be using vector data for this project.
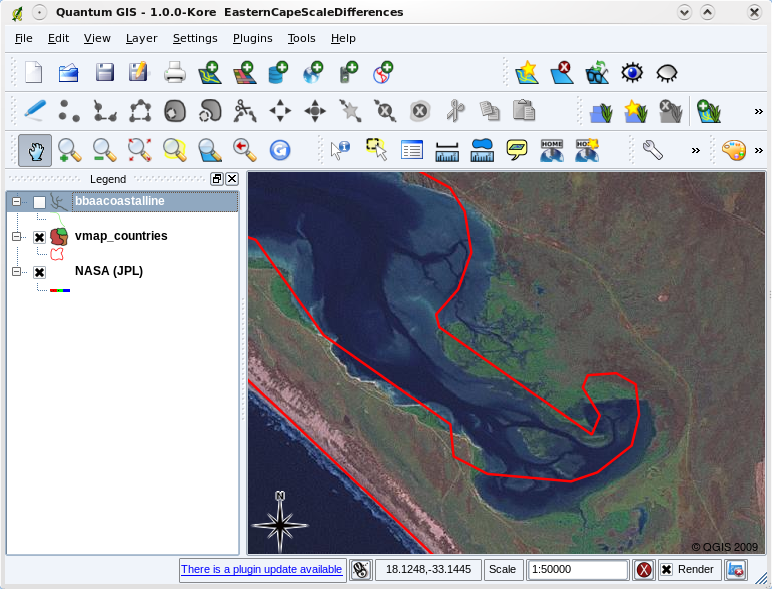
Vector data (red lines) that was digitised from a small scale (1:1000 000) map
Raster: Raster data uses a grid of equally sized cells, or pixels, to show information that changes continuously across an area, such as elevation, temperature, or satellite images.

Example of raster data, Environmental Systems Research Institute, n.d.
Coordinate Reference Systems (CRS)
A Coordinate Reference System (CRS) is how the 3D world is flattened into a 2D digital map. This process inherently requires distortion; CRSs minimize distortion by trying to stretch the Earth’s surface more precisely to a specific area. Selecting the correct CRS for your project is really important because it ensures your measurements are precise, your map layers line up correctly, and the spatial relationships between features are shown accurately.
2. Setting Up Your Project
Let's gather our materials and set up the QGIS environment.
2.1 Download and Install QGIS
Note: If you are working on a short-term project or prefer not to install new software on your computer, here are some alternative options available to Barnard/Columbia students:
- University Computers: Most desktop computers at Barnard and Columbia libraries and labs have QGIS pre-installed, including at the ERC’s computer lab (Milstein 102).
- Loaner Laptops: The ERC offers laptops with QGIS installed for rental.
- Remote Desktop: You can use Columbia's remote desktop service, Apporto. Visit this link for more information on how to set that up.
If you don't have it already, you'll need to install QGIS.
- Navigate to the official QGIS Download Page.
- It's highly recommended that you download the Long Term Release (LTR) version, as it's the most stable. Click the download button for your operating system (Windows or macOS).
- Once the download is complete, run the installer and follow the on-screen instructions.
2.2 Download Project Data
We need three datasets for our project:
-
NYC Census Tracts (2020): Download Shapefile
(Choose "2020 Census Tracts (Water Areas Included) - Shapefile")
-
NYC Borough Boundaries: Download Shapefile
(Choose "Borough Boundaries (Water Areas Included) - Shapefile")
-
Median Rent Data: Download CSV
This data will come from the American Community Survey (ACS).
Instructions to download the Median Rent Data (CSV):
- Go to the U.S. Census Bureau's data portal: data.census.gov
- In the main search bar, type B25064 and press Enter. This is the table ID for "Median Gross Rent (Dollars)."
- From the search results, click on the table titled B25064: MEDIAN GROSS RENT (DOLLARS).
- In the "Filters" panel, click on "Geos."
- In the "Select Geographies" pop-up window:
- Geography type: "Census Tract."
- State: "New York."
- Select all five NYC counties (Bronx, Kings, New York, Queens, Richmond).
- The table will refresh. Confirm the "Year" is set to a recent "ACS 5-Year Estimates".
- Click the "Download" button.
- In the pop-up, check the box for the correct year and click "DOWNLOAD .ZIP".
- This will download a compressed .zip file to your computer.
2.3 Create Project and Add Layers
Create a project folder, unzip your shapefiles into it, and add the CSV. Launch QGIS, save your project (Project > Save As...), and drag all three files (nyct2020.shp, nybb.shp, and the CSV) into your Layers Panel.
2.4 Set the Project CRS
Look at the bottom-right of the QGIS window. It likely says EPSG:2263. Let's set it to a local projected CRS.
- Click on EPSG:2263 in the bottom-right corner.
- In the search box, type EPSG:3857.
- Select EPSG:3857 and click OK.
3. Data Preparation and Wrangling
Real-world data is rarely perfect. This section covers cleaning and preparing data for analysis.
3.1 Create a clean GEOID join key
Our goal is to accurately join the rent data to the census tracts. For a successful join, the "key" fields in both datasets must match. Let's inspect them:
- In the CSV, the identifier is GEO_ID (e.g., "1400000US36005000100").
- In the shapefile, the identifier is GEOID (e.g., 36005000100).
We must clean the GEO_ID field to remove the unnecessary prefix.
Steps to create the clean join key:
- With your CSV layer's attribute table open, click the Toggle editing mode button.
- Click the Open field calculator button.
- In the Field Calculator dialog:
- Check "Create a new field."
- Output field name: GEOID
- Output field type: Select "String."
- In the Expression box, type:
substr("GEO_ID", 8, 11) - Click OK, then Save Edits and toggle editing mode off.
3.2 Joining Tables
Now we can perform the join.
- Open the nyct2020 layer's Properties > Joins.
- Click the green + icon and set up the join:
- Join Layer: Your CSV file.
- Join Field: The new GEOID field.
- Target Field: GEOID.
- Click OK.
3.3 Cleaning Median Gross Rent Values
The rent data field (Tract_B250) contains non-numeric characters (+, -, ,) that must be removed for mapping.
Important Note on "3,500+": Converting "3,500+" to "3500" is a necessary simplification. Be aware that this might slightly underestimate the true median for these high-rent areas.
Steps to clean the Median Gross Rent values:
- Open the attribute table of your nyct2020 layer.
- Toggle editing mode on, then open the field calculator.
- Check "Update existing field" and select Tract_B250.
- In the Expression box, type this expression:
CASE
    WHEN "Tract_B25064_001E" = '-' THEN NULL
    ELSE to_real(regexp_replace("Tract_B250", '[^0-9.]', ''))
END
- Click OK, then save edits and toggle editing off.
[Video placeholder: Cleaning median values.mp4]
Now, convert these values into whole numbers (integers).
- Go back into the field calculator.
- In the dialog:
- Check "Create a new field."
- Output field name: MedianRent
- Output field type: Select "Integer 32-bit."
- In the Expression box, type:
to_int("Tract_B250")
- Click OK, then Save Edits and exit editing mode.
Your MedianRent field is now ready!
4. Spatial Analysis: Clipping to a Study Area
Our goal is to map rent in Manhattan. We will use the Clip tool to cut our data to the boundary of Manhattan.
First, select the Manhattan polygon from the nybb layer using the Select Features tool.
Now, run the Clip tool:
- Go to Vector > Geoprocessing Tools > Clip.
- Input layer: nyct2020.
- Overlay layer: nybb. Check the box for Selected features only.
- Clipped: Save the file as Manhattan_Tracts_Rent.shp.
- Click Run.
5. Data Visualization (Symbology)
Understanding Classification Modes
The "Mode" setting in QGIS determines how data is divided into classes, which significantly impacts your map's message. We'll use Natural Breaks (Jenks), which identifies statistically significant "breaks" to group similar values together.
Now we will style our Manhattan_Tracts_Rent layer.
- Open the layer's Properties > Symbology.
- Change the renderer to Graduated.
- Value: Select the MedianRent field.
- Color ramp: Choose a ramp like Viridis or Blues.
- Mode: Choose Natural Breaks (Jenks).
- Click Classify, then OK.
6. Final Map Production (The Print Layout)
The last step is to compose your map with a title, legend, and other essential elements.
- Go to Project > New Print Layout...
- Use the Add Map button to draw your map.
- Add a Title, Legend, North Arrow, and Scale Bar.
- Tip: Clean the legend by unchecking Auto update and renaming items.
- Add a Grid: In the map's Item Properties, go to Grids, click +, then Modify Grid... to set the interval.
- Add Source Info: Use the Add Label tool.
- Export: Go to Layout > Export as PDF... or Export as Image...
Work cited:
- Environmental Systems Research Institute. (n.d.). What is raster data?. ArcGIS Desktop. Retrieved October 10, 2025, from http://desktop.arcgis.com/fr/arcmap/latest/manage-data/raster-and-images/what-is-raster-data.htm
- QGIS Development Team. (n.d.). A Gentle Introduction to GIS: Vector Data. QGIS Documentation. Retrieved October 10, 2025, from https://docs.qgis.org/3.40/en/docs/gentle_gis_introduction/vector_data.html
By: Rayhana Mouaouia