Getting Started with EXCEL
This guide covers the basics of Excel. Using real-world data, beginners will learn some of the software’s key functions for data analysis and data visualization.
What is Excel?
Microsoft Excel is a spreadsheet software that allows you to organize, format, and analyze tabular data; that is, data written in a table as rows and columns.
In this guide, you’ll learn how to:
⭐ Create a new Excel file
⭐ Organize data
⭐ Write formulas manually and using built-in functions
⭐ Make and export charts
In this guide, you’ll learn how to:
⭐ Create a new Excel file
⭐ Organize data
⭐ Write formulas manually and using built-in functions
⭐ Make and export charts

Getting Started
When you open Excel for the first time, you’ll be prompted to either create a new workbook or open an existing file on your computer. A workbook in Excel is the entire file containing one or more worksheets (also called “spreadsheets” or “sheets”). Each worksheet is a separate tab where you can enter, organize, and analyze data.Let’s select the ‘Blank Workbook’ option. As you can see in the figure below, a worksheet consists of a grid of cells arranged in horizontal rows and vertical columns.
In most spreadsheets, rows are identified by numbers and columns are identified by letters. Cells are identified by the row-column combination, called a cell reference. For instance, highlighted cell A1 refers to the cell in column A and row 1.
Example: NYC Airbnb Open Data
Now, let’s open our example dataset in Excel. Go to the ‘Open’ tab and select the file called AB_NYC_2019.xls. Click through the workbook’s three sheets to familiarize yourself with the data.
![]()
This dataset contains public information about Airbnb listings in New York City. Taken from the publicly available New York City Airbnb Open Data, this dataset contains information on the city’s 48,895 Airbnb listings in 2019. You can download the Excel workbook here.
We will use this data to examine the relationship between Airbnb listings and geographic location. The map below visualizes these data, using the Latitude and Longitude variables in Sheet3. Each light green dot on the NYC map represents a single observation, or Airbnb listing.

Data Organization
The convention is to organize your data with observations as rows and variables as columns. In Sheet1, each observation is an Airbnb listing. Therefore, each cell corresponds to a particular attribute of an individual Airbnb listing.
You can see the cell reference of the cell(s) you have selected in the top left corner, directly above the spreadsheet. In the figure below, B1 is selected and the contents of the cell, “Listing_Name”, are displayed to the right in the formula bar.
To select an entire column, simply click on the letter above that column.
To select an entire column, simply click on the letter above that column.

Likewise, to select a row, click on the number to the left of that row.

Data Types
Data can take on many forms. Our example dataset includes numerical, categorical, and binary variables.⭐ Numerical data refers to any variable that can be ordered or measured on a number line. For example, Price is numerical because it records the nightly cost in dollars for each listing — a value that can be sorted or averaged.
⭐ Categorical data includes variables that represent distinct categories rather than continuous measurements. These can be either text or numeric codes that stand for groupings. In our dataset, Borough (e.g., Manhattan, Brooklyn, Queens, Bronx, Staten Island) and Room Type (e.g., Entire home/apt, Private room, Shared room) are categorical variables because they describe listing characteristics that fall into fixed categories.
⭐ Binary variables take on only two values, typically 1 and 0, representing true/false or yes/no outcomes. In our dataset, the Manhattan? variable denotes whether a listing is in Manhattan (1) or not (0).
Calculations
One of the reasons Excel is useful for data analysis is that it allows you to perform calculations using formulas. Formulas in Excel always begin with an equals sign “=”.We will now calculate the minimum spend for each airbnb by multiplying Price and Minimum_Number_of_Nights. To calculate the minimum spend, you will need to first label a new column for this new variable. In the first empty cell, Q1, label this new variable Minimum_Spend.
Then, in the cell below we’ll write the formula. In Q2, type an equals sign (“=”) and then click on the cell you’d like to use in your calculation. Here we want to multiply J2 by K2, so we’ll click on J2, type an asterisk (“*”) for multiplication, and then click on K2. Then, just hit enter. Instead of clicking on the cell references, you can also type in the cell references directly, by simpling typing in “=J2*K2”.

NOTE: you can write in the numbers directly for your calculation, but the nice thing about using cell references is that if the data in that cell ever changes, the formula will use that new data, and your results will change accordingly. Additionally, if you use cell references you can apply the formula to the entire column.

Then, to apply this calculation to the whole column, select Q2 and place your cursor over the bottom right corner of Q2. Your cursor will become a small black cross. Click and drag down to the last observation.


For a nice shortcut, double click on the cross at the bottom right corner of the selected cell. This will copy the formula down the entire column, or down to your last observation. However, sometimes this shortcut won’t apply to the entire column, such as when there is missing data in one of the rows.
You’ll see that the same calculation is applied to each row, using the relevant information from that row. This method is called relative referencing. As you can see in the figure below, even though we typed “=J2+K2” the formula in the sixteenth row says “=J16+K16” instead.

Built-in Functions
Rather than type out every calculation manually, or to carry out more complex calculations, you can use Excel’s built-in functions.Let’s calculate the average nightly cost of NYC Airbnbs in 2019 using the average function. In cell S1 type the label Average Price. In cell S2 , enter the formula “=AVERAGE(J2:J48895)”. Instead of typing the cell references, you can also click on cell J2 and drag the cursor down to cell J48895 before typing the close parenthesis. However, for such a large dataset, this won’t be as efficient.


You can find a full list of Excel’s built-in functions here or directly in Excel under ‘Formulas’ > ‘Insert Function’ > ‘Formula Builder’.
Charts
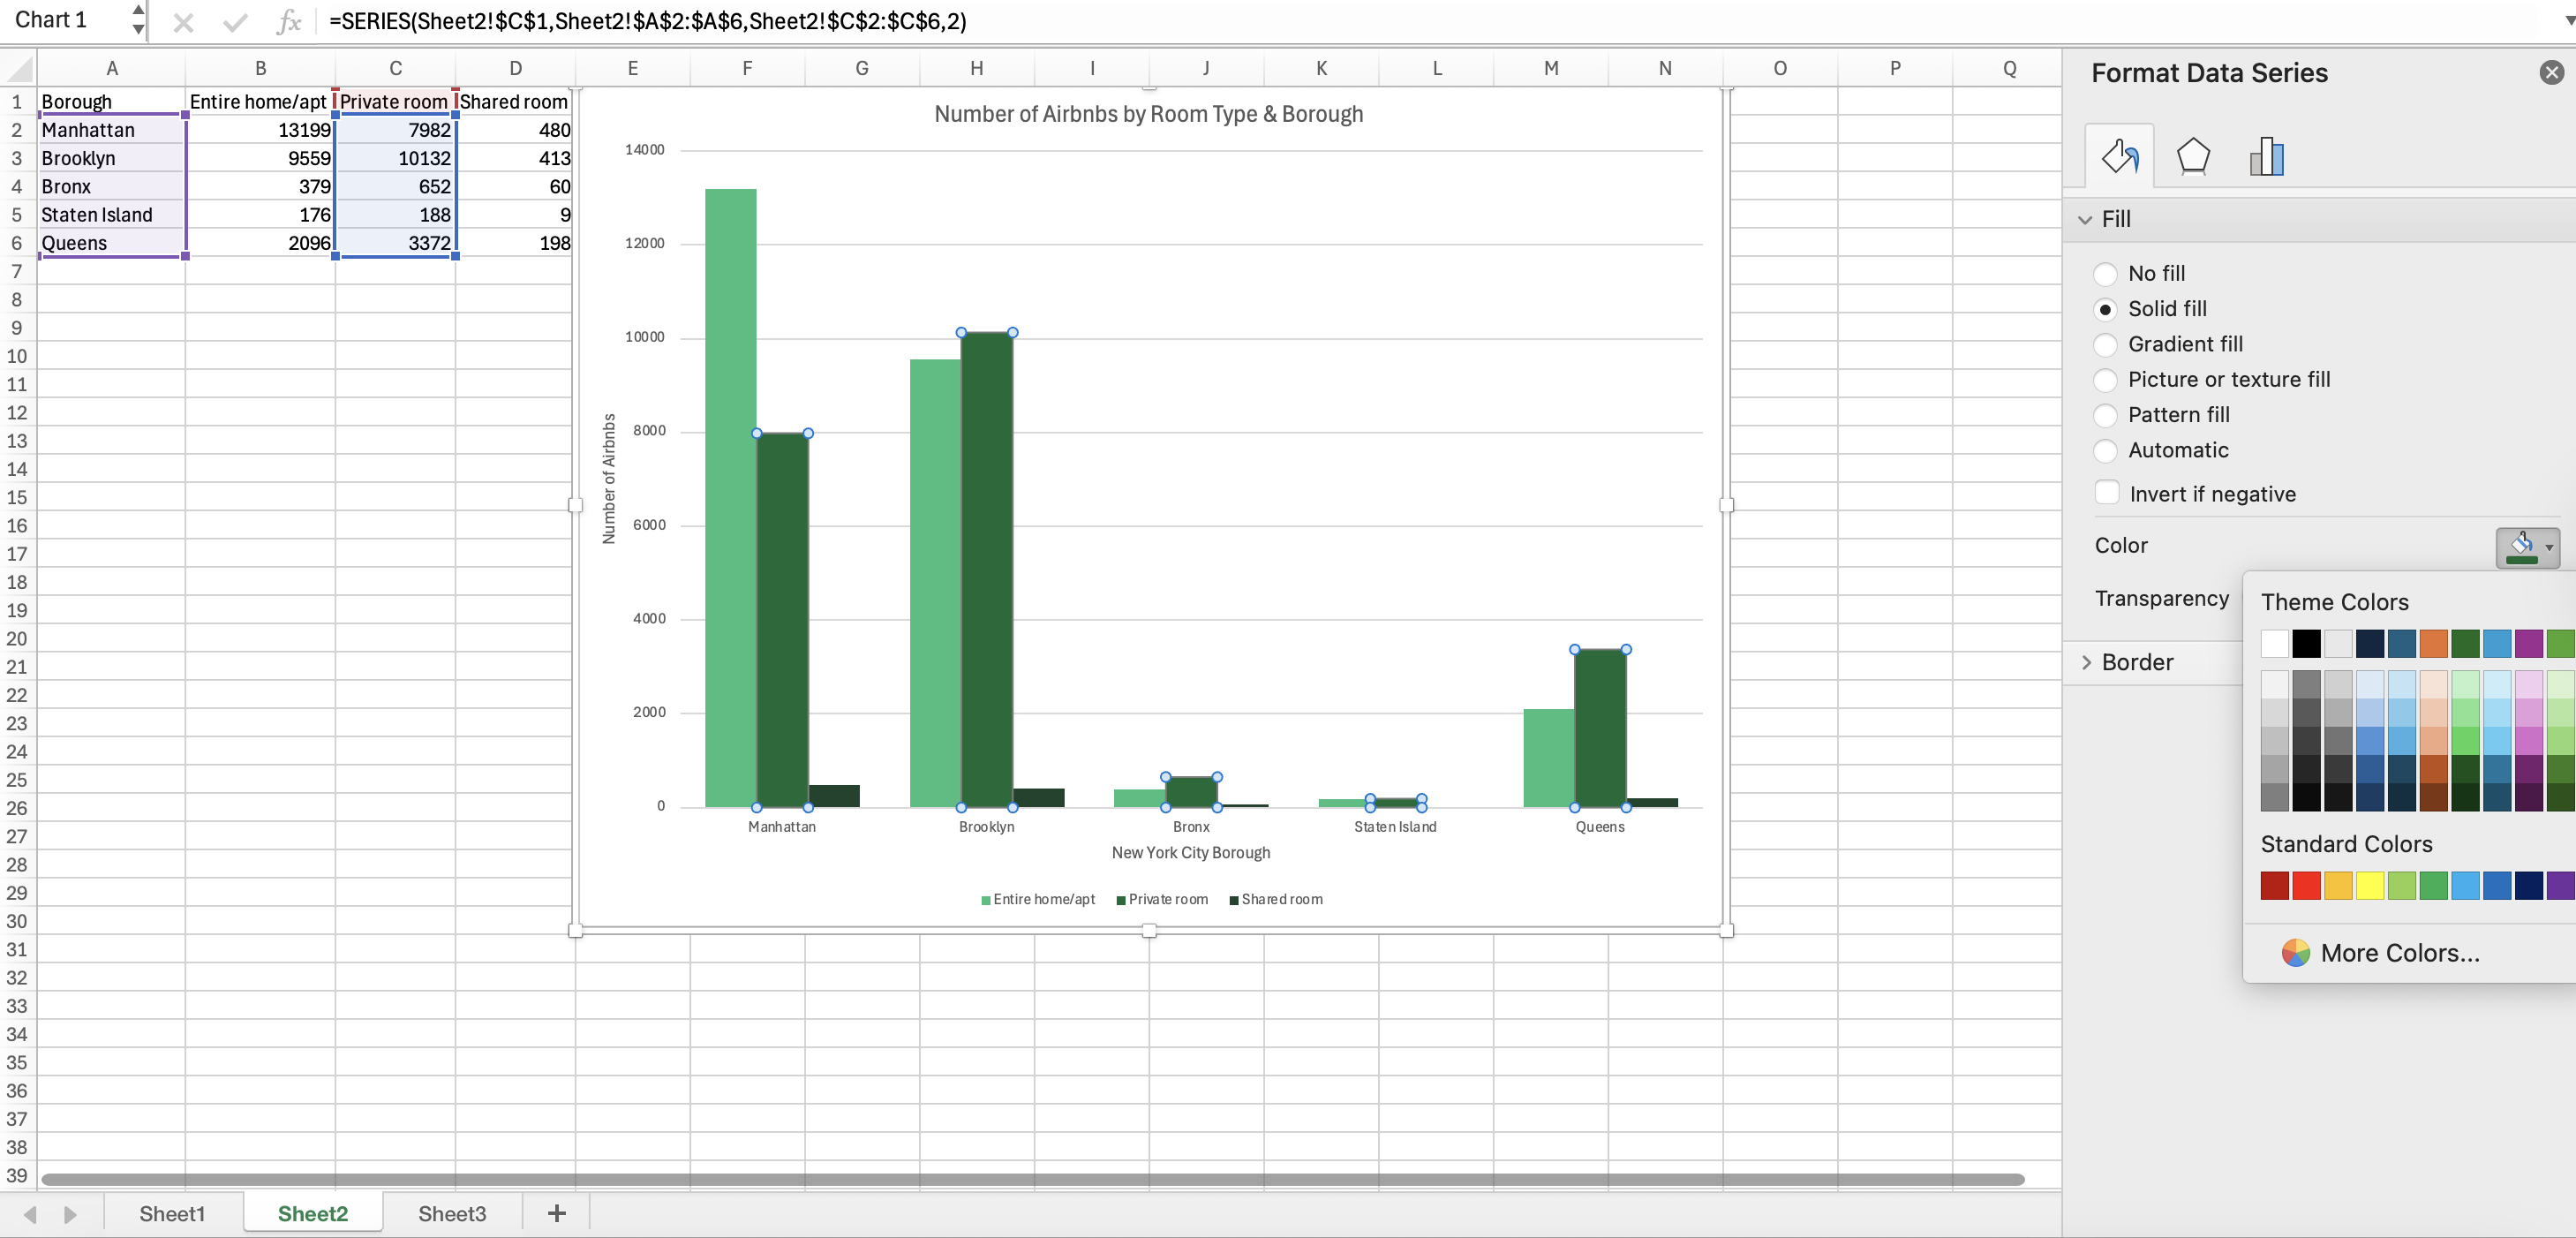
Charts can be extremely useful in data analysis because they help visualize patterns and trends in the data that might be difficult to detect or communicate to others through raw numbers.We’ll plot the distribution of the three Airbnb room types across the five New York City boroughs as a clustered column chart. Let’s go to Sheet2 which contains Airbnb counts based on the Room Type and Borough variables. First, we’ll highlight the data we want to be included in the chart. Then, go to the ‘Insert’ tab and select the kind of chart you want to create.


To edit things like the color of the bars or the amount of space between them, simply double click on the bars. Then you can play around with the chart design in ‘Format Data Series’ which will appear on the right side of the screen.![]()

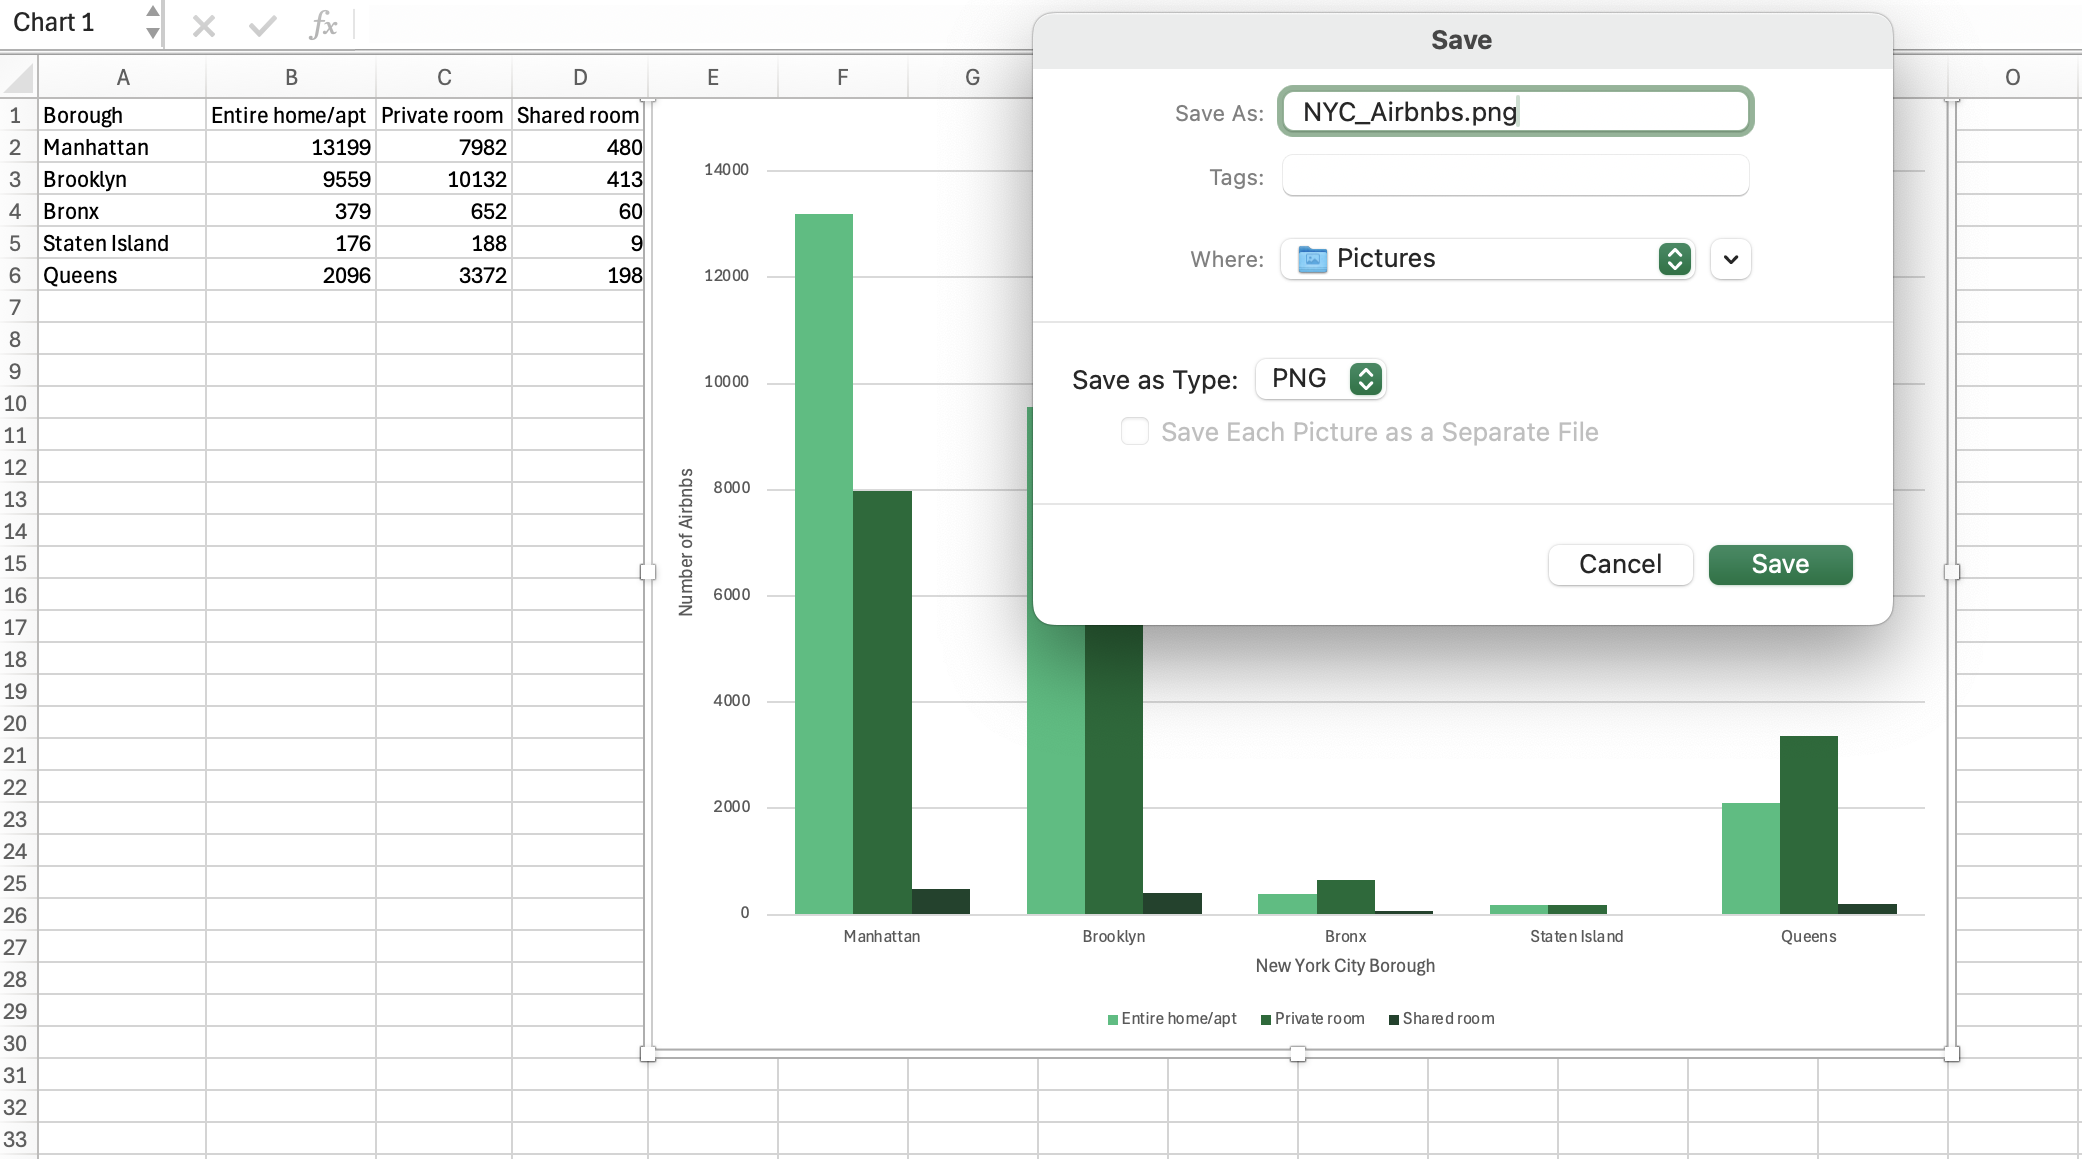
To export your chart, double-click on the chart and then select ‘Save as Picture’ from the dropdown menu. You’ll then be prompted to choose a file name, location, and image format (.jpg, .png, etc.) for your chart.

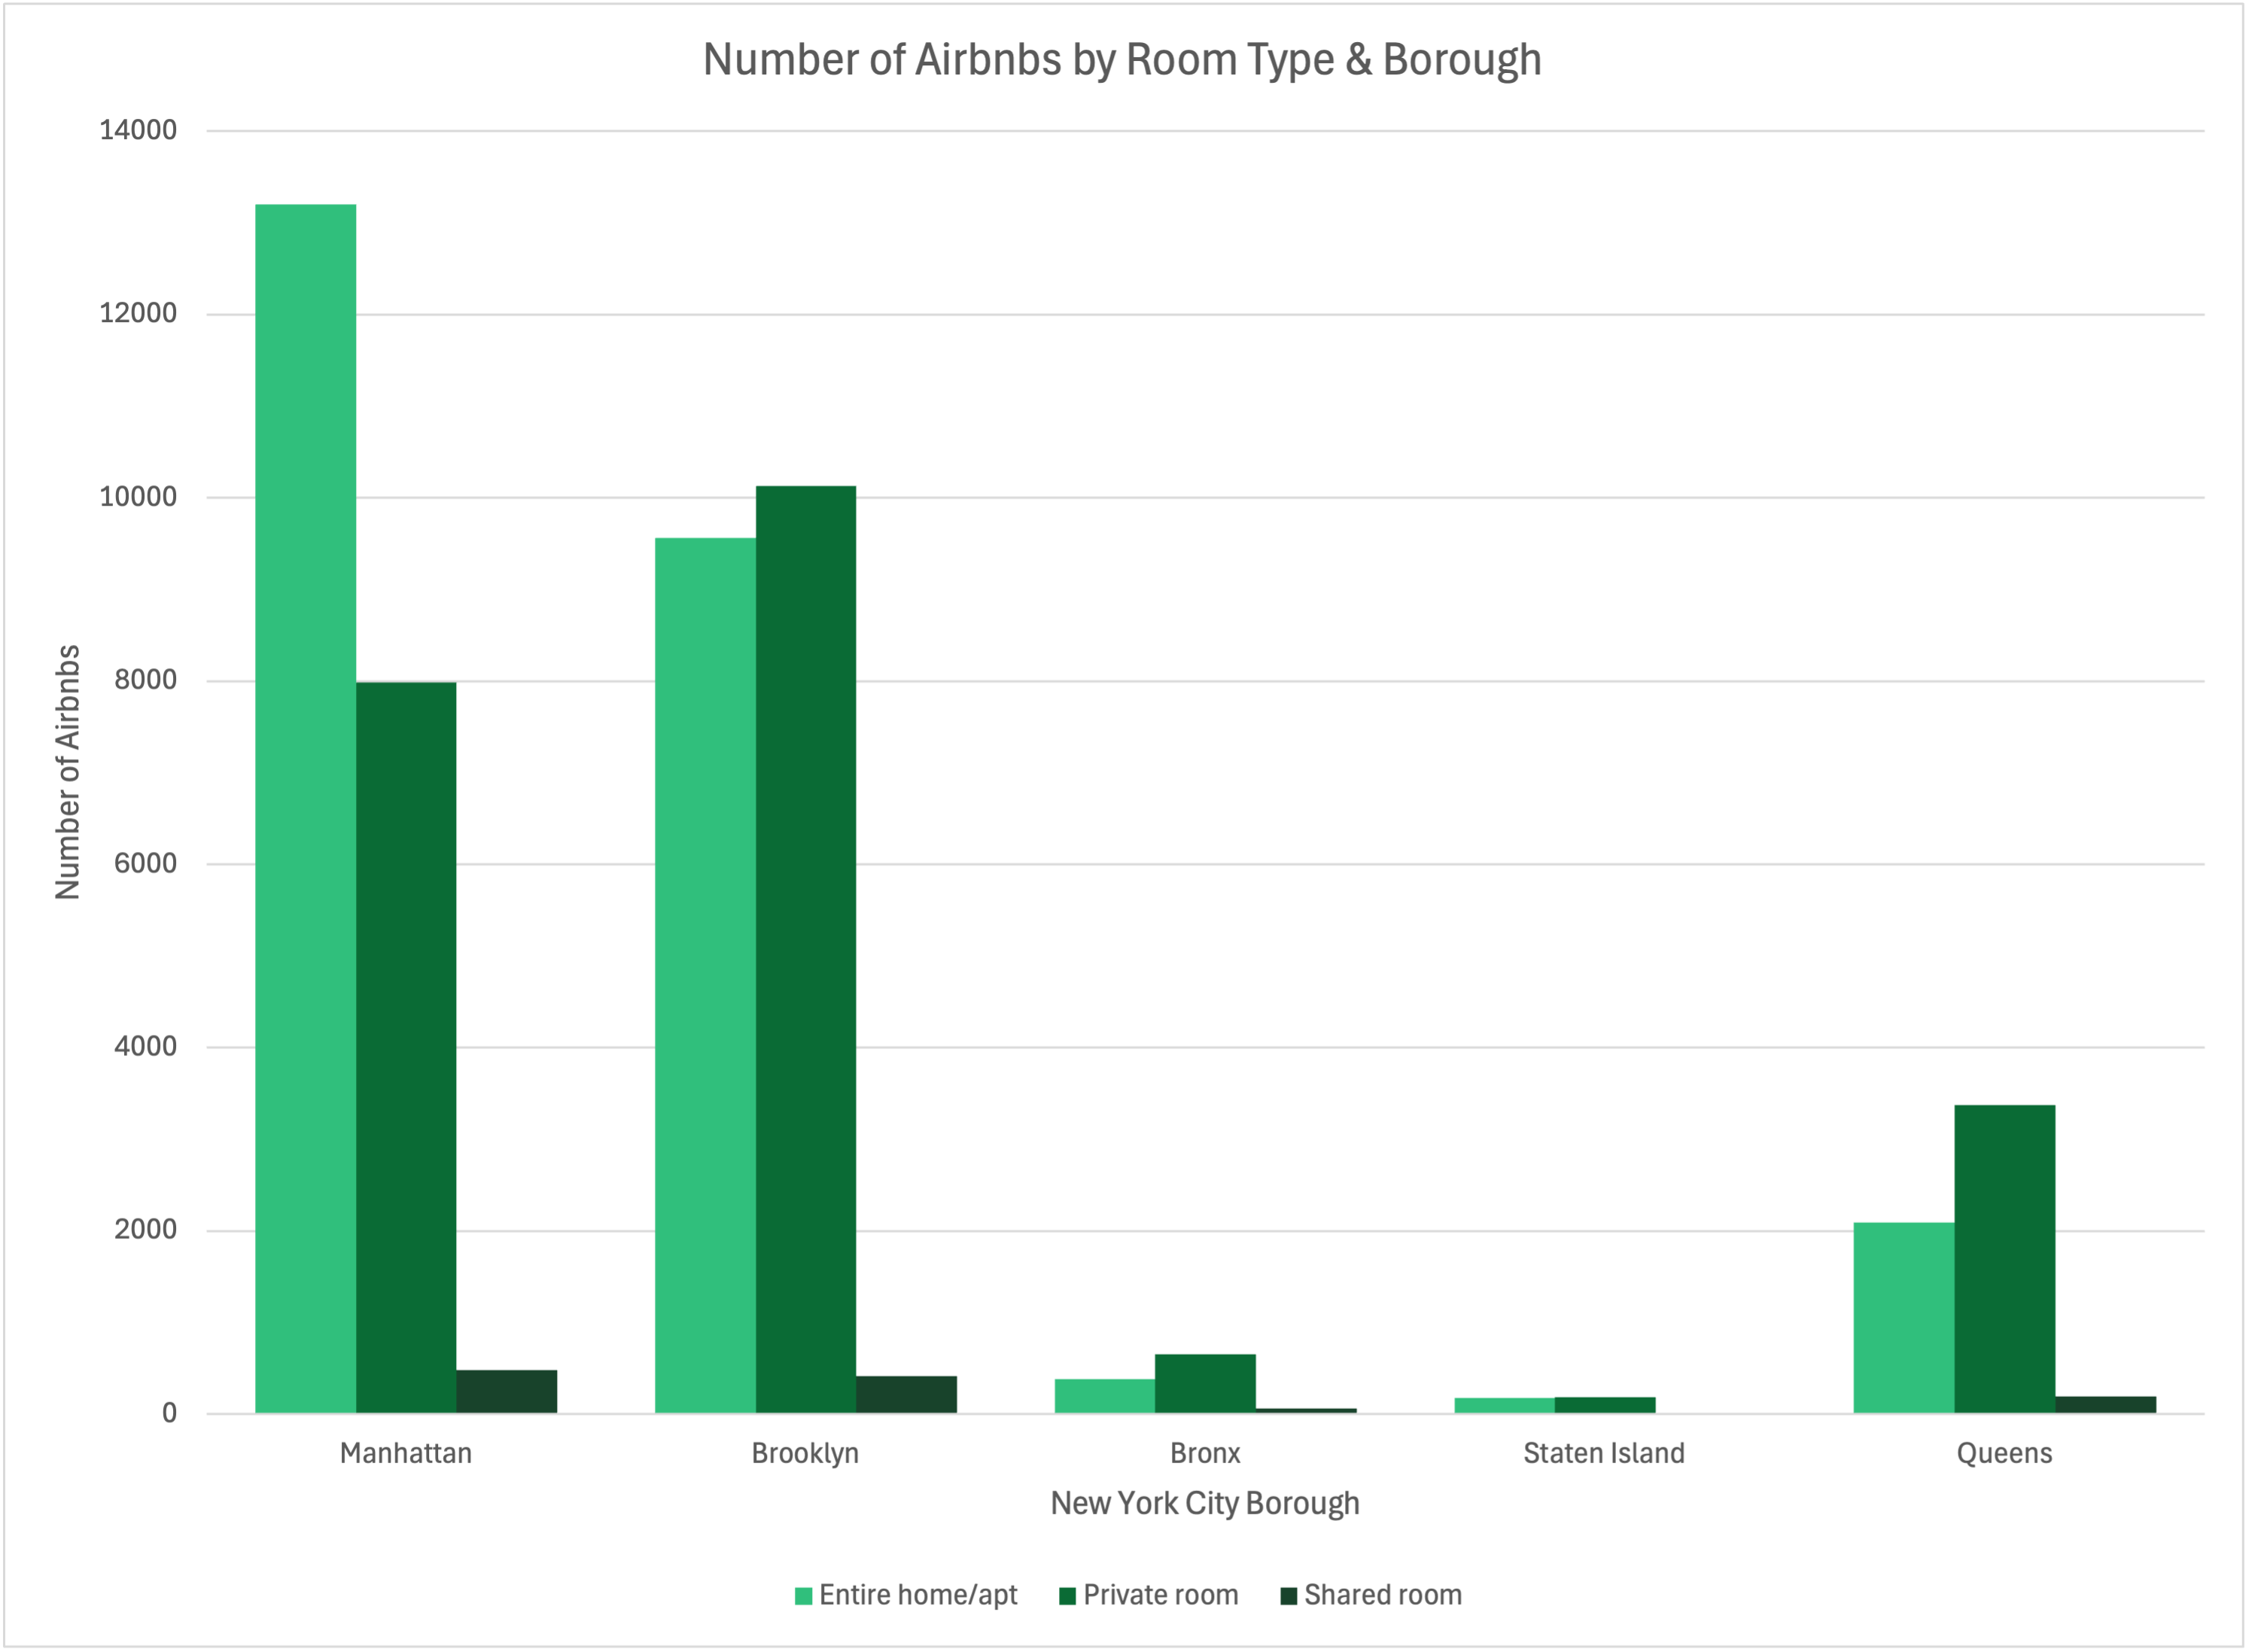
You can also just copy (CTRL + C) and paste (CTRL + V) your chart into a document directly. Using one of these methods, we get our finished chart!
Best Practices
There are often multiple ways to complete a given task in Excel. This section will briefly run through some “best practices” for efficiently organizing and visualizing your data in Excel—these will make you less likely to run into errors or make mistakes down the line!Variable Names
When labeling new variables, it’s wise to keep the names concise and avoid spaces. For instance, when we made our new variable for the minimum amount required to spend for a given Airbnb, instead of labelling the column “Minimum Spend”, we called it “Minimum_Spend”, with an underscore. This way, the variable names remain readable and won’t be changed if your data is imported into statistical softwares like R or Python.Column Names in the First Row
Always place your column names in the very first row of your spreadsheet. Excel recognizes the top row as headers, which allows functions like filters, pivot tables, and charts to automatically detect and label variables. It is best to avoid leaving blank rows above your data or mixing headers with notes or titles, which might cause errors when inserting charts later, for instance.Cell References in Calculations
When writing formulas, use cell references rather than typing numbers directly into the formula. For example, use “=B2*C2” instead of “=5*3”. This way, if you change a value in one of the cells, the result updates automatically.Descriptive Chart and Axis Titles
When creating charts, always include clear titles and axis labels that describe what the data represents. For example, instead of a chart titled “Prices,” use “Average Airbnb Price by Neighborhood.” Also, make sure to label your axes with both the variable name and units, such as “Price (USD)” to avoid any confusion and make your graph interpretable.Glossary
⭐ Cell: the intersection of a row and column⭐ Cell reference: the unique address of a cell (e.g., A1, F4, G23)
⭐ Column: vertical arrangement of cells, identified by capital letters
⭐ Formula: a set of values, cell references, names, functions, or symbols in a cell that together produce a new value
⭐ Function: a predefined formula in Excel that performs a specific calculation (e.g., SUM, AVERAGE, VLOOKUP)
⭐ Operator: a symbol indicating the type of calculation to be performed (+, -, *, /)
⭐ Range: two or more cells on a sheet; the cells in a range can be adjacent or nonadjacent
⭐ Relative reference: a cell address that automatically adjusts when the formula containing it is copied to another cell
⭐ Row: horizontal arrangement of cells, identified by numbers
⭐ Tabular data: data arranged in rows and columns
⭐ Workbook: the Excel file itself, containing one or more worksheets in which you can enter and calculate data
⭐ Worksheet: the primary document that you use in Excel to store and work with data, organized into rows and columns
Additional Resources
Microsoft Support | Excel Help & Learning
ERC Cargo Site | How Do I...?
New York City Airbnb Open Data via Kaggle
By: Noura Angulo
ERC Cargo Site | How Do I...?
New York City Airbnb Open Data via Kaggle
By: Noura Angulo